ChartPixel
Overview of ChartPixel
ChartPixel: AI-Powered Data Analysis and Visualization
What is ChartPixel? ChartPixel is an AI-driven data analysis tool that transforms messy data into interactive charts and actionable insights. It empowers users to make data-driven decisions effortlessly, regardless of their coding skills or data analysis expertise.
How does ChartPixel work? ChartPixel utilizes AI to automate the data analysis process. It cleans, formats, and visualizes data, extracting trends, correlations, and statistics to generate clear insights. Users can also chat with their data and charts to uncover key information through AI-driven analysis.
Key Features:
- AI-Assisted Analysis: ChartPixel uses AI to analyze data, identify patterns, and generate insights.
- Interactive Charts: Create various chart types, including maps, scatter plots, and animations, to visualize data effectively.
- No-Code Platform: The user-friendly interface requires no coding knowledge, making it accessible to everyone.
- Data Cleaning: Automatically handles missing values, country codes, units, and currencies.
- Insight Generation: Provides AI-assisted written insights and descriptions, backed by statistics.
- Collaboration: Share charts and projects with others through a link or export them to PowerPoint.
- Chat with Data: Users can directly chat with data to ask questions and get insights.
Why is ChartPixel important? ChartPixel is important because it democratizes data analysis. It empowers individuals and organizations to extract valuable insights from their data without the need for specialized skills or expensive tools. This leads to better decision-making, increased efficiency, and improved outcomes.
Who is ChartPixel for?
ChartPixel is designed for a wide range of users, including:
- Business Owners: Gather data and insights independently to drive better decision-making.
- Data Analysts: Save time and effort by automating data cleaning, formatting, and visualization.
- Researchers: Explore new dimensions in their work with robust statistical methods.
- Students: Learn data analysis without coding and become passionate about data.
- Journalists: Create charts and forecasts to enhance journalistic content.
- Hobby Analysts: Make sense of personal datasets, such as sports statistics or personal lists.
How to use ChartPixel?
- Upload Data: Upload your data in various formats, such as spreadsheets or webpage tables.
- Explore Charts: ChartPixel automatically generates a gallery of interactive charts and insights.
- Analyze Insights: Review the AI-assisted written insights and descriptions.
- Customize Charts: Customize the charts to match your needs.
- Share or Export: Share your charts with others or export them to PowerPoint.
- Chat with Data: Ask questions directly to the data.
Use Cases:
- Business Data Analysis: Analyze sales data, marketing campaigns, and customer feedback.
- Questionnaire Analysis: Uncover insights from surveys and questionnaires.
- Research and Education: Explore data for academic research and education purposes.
- Everyday Decision-Making: Make informed decisions in personal and professional life.
What our users say about us
- András Borza, Sn. Project Engineer, Mitsuba: "ChartPixel has immediately saved me time at my job and helps me to present data driven insights."
- Jeffrey Akiki, Co-Founder, Not Diamond: "Very cool product! It streamlines data visualization, freeing up more of your time for in-depth data analysis."
- Cristian Sepulveda-Irribarra, Researcher, Research group IEFID: "ChartPixel offers a series of possibilities to speed up the research process with statistical analysis. I've been looking for a tool like this for a long time, and I think it's quite complete."
Pricing:
Please refer to the ChartPixel website for the latest pricing information.
Best way to analyze data? ChartPixel stands out as an intuitive AI data analysis tool. It's a great tool that has been improving every day, which is a testament to the care and commitment of its developers!
Best Alternative Tools to "ChartPixel"

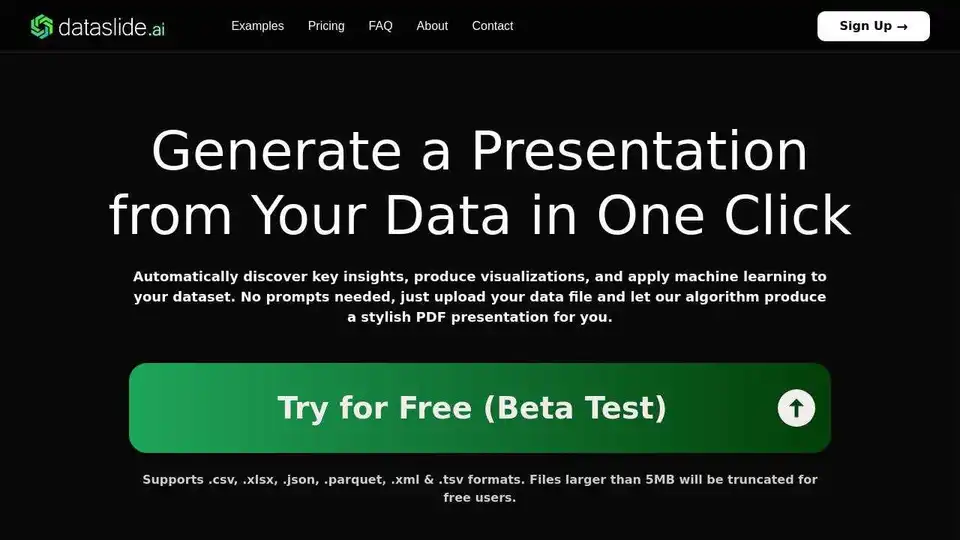
Dataslide.ai automatically generates stylish PDF presentations from your data. Upload your data file and let AI discover key insights, produce visualizations, and apply machine learning. Supports .csv, .xlsx, .json, etc.

Excelmatic is an AI-powered tool that simplifies Excel data analysis and visualization. Upload your Excel file, ask questions in plain English, and get instant insights and charts without needing complex formulas.

Quills AI: AI-powered platform for data analysis & visualization, generating SQL queries through natural language. Boost data-driven decisions and integrate with Slack.

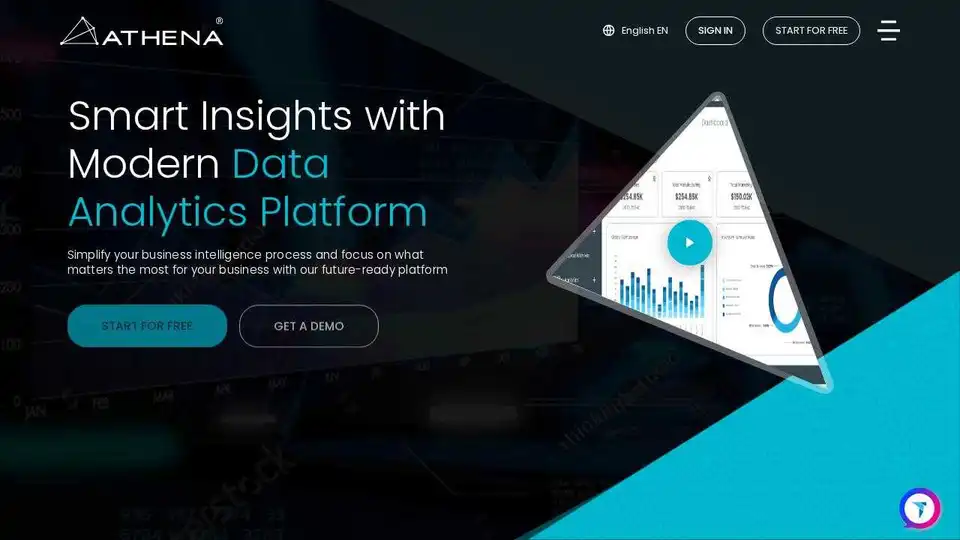
Athena AI is an AI-powered data analytics and BI platform that transforms raw data into actionable insights. Get real-time business insights with advanced data visualization and predictive analytics.