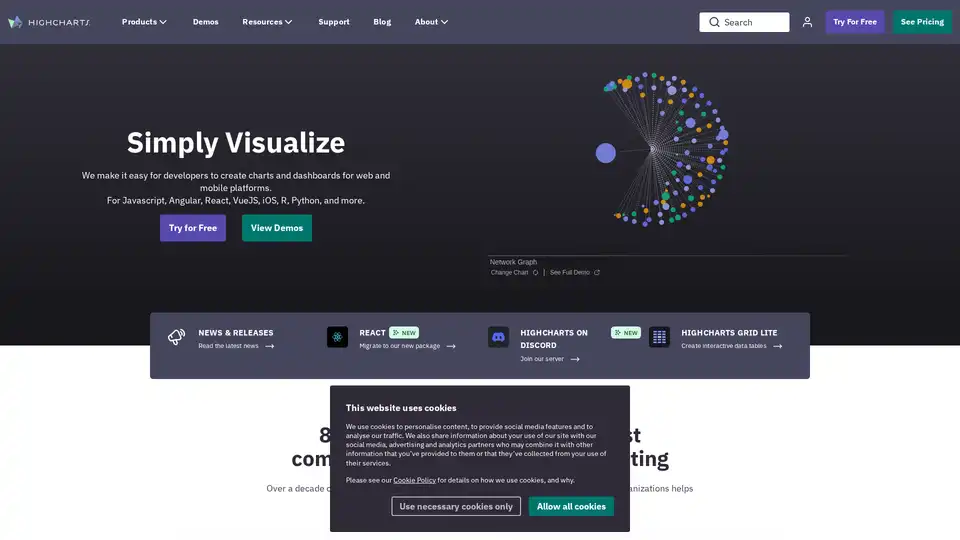
Highcharts
Overview of Highcharts
Highcharts: The Leading Interactive Charting Library for Developers
What is Highcharts? Highcharts is a powerful JavaScript charting library designed to simplify the creation of interactive and visually appealing charts and dashboards for web and mobile applications. Trusted by over 80 of the world's 100 largest companies, Highcharts provides developers with a comprehensive set of tools to effectively present data.
How does Highcharts work? Built on JavaScript and TypeScript, Highcharts is compatible with any backend database or server stack. It offers wrappers for popular programming languages like .Net, PHP, Python, R, and Java, as well as frameworks like Angular, Vue, and React. The library is highly customizable, allowing developers to tailor charts to their specific needs.
Key features of Highcharts include:
- Versatile Chart Types: Highcharts Core includes essential chart types such as line, bar, area, and column charts.
- Interactive Maps: Highcharts Maps allows you to build interactive maps linked to geography.
- Timeline Charts: Highcharts Stock is designed for creating stock or general timeline charts.
- Gantt Charts: Highcharts Gantt helps you display tasks and events along a timeline.
- Responsive Dashboards: Highcharts Dashboards enables you to set up responsive and accessible dashboards in minutes.
- Data Tables: Highcharts Grid allows you to create interactive, responsive data tables.
- Premium Support: Highcharts Advantage provides premium support and access to all new Highcharts releases.
Why choose Highcharts? Highcharts stands out as a reliable and secure solution for data visualization due to several factors:
- Developer-Friendly: The ease of use and customization options make it a developer-friendly library. Its documentation is well-organized, and the examples are more than sufficient to get you started.
- Cross-Platform Compatibility: Highcharts works seamlessly with various programming languages and frameworks, making it a versatile choice for different projects.
- Trusted by Industry Leaders: The trust of numerous large organizations highlights Highcharts' reliability and effectiveness.
Who is Highcharts for? Highcharts is suitable for a wide range of users, including:
- Developers: Those who need to create interactive charts and dashboards for web and mobile platforms.
- Data Analysts: Those who need to visualize data effectively for analysis and presentation.
- Businesses: Those who need to present data in a clear and engaging way for internal and external stakeholders.
How to use Highcharts? Getting started with Highcharts is straightforward:
- Choose the appropriate Highcharts library based on your charting needs (e.g., Highcharts Core, Highcharts Maps).
- Include the Highcharts library in your project.
- Create a chart container in your HTML.
- Configure the chart options using JavaScript.
- Render the chart in the container.
Best way to create stunning data visualizations?
To maximize the impact of your data visualizations with Highcharts:
- Choose the right chart type for your data.
- Customize the chart's appearance to match your brand.
- Make the chart interactive to engage users.
- Ensure the chart is accessible to all users.
Customer Review
Saurabh M., a Senior Software Engineer at Coditation Systems, describes Highcharts as "probably the best and the only charting library you need." He praised its ease of use, customization, well-organized documentation, and helpful examples. He also noted that most UI frameworks/libraries have a wrapper for Highcharts, making it easy to integrate into any project.
Stay Up to Date
To stay informed about the latest news, tips, and tricks for Highcharts, you can subscribe to their newsletter. This will help you get the most out of your Highcharts products and keep you updated on new features and releases.
Join the Community
Highcharts encourages users to join their vibrant community on GitHub, Stack Overflow, and other forums. This provides a platform for additional assistance, platform-specific implementation advice, and sharing ideas and feedback.
Highcharts is a comprehensive and versatile charting library that empowers developers to create engaging and informative data visualizations. Its ease of use, customization options, and cross-platform compatibility make it an excellent choice for a wide range of projects.
Best Alternative Tools to "Highcharts"
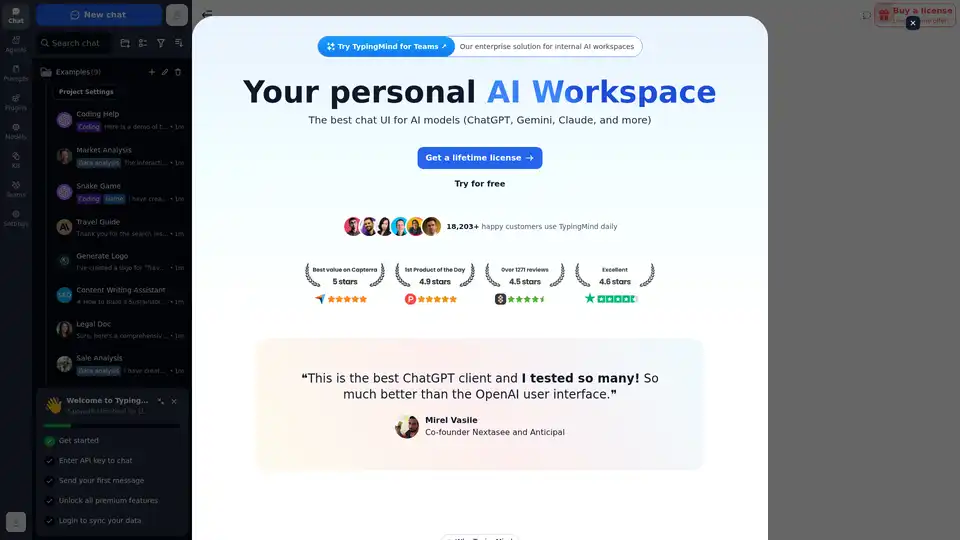
Chat with AI using your API keys. Pay only for what you use. GPT-4, Gemini, Claude, and other LLMs supported. The best chat LLM frontend UI for all AI models.
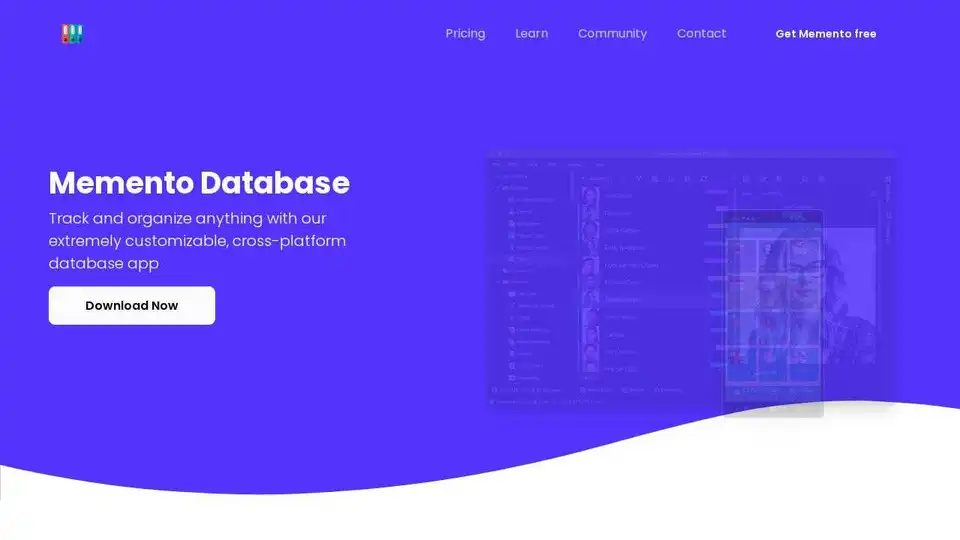
Memento Database is a powerful AI-enabled data management tool for businesses & personal use. Organize, analyze, & visualize data across platforms with ease.
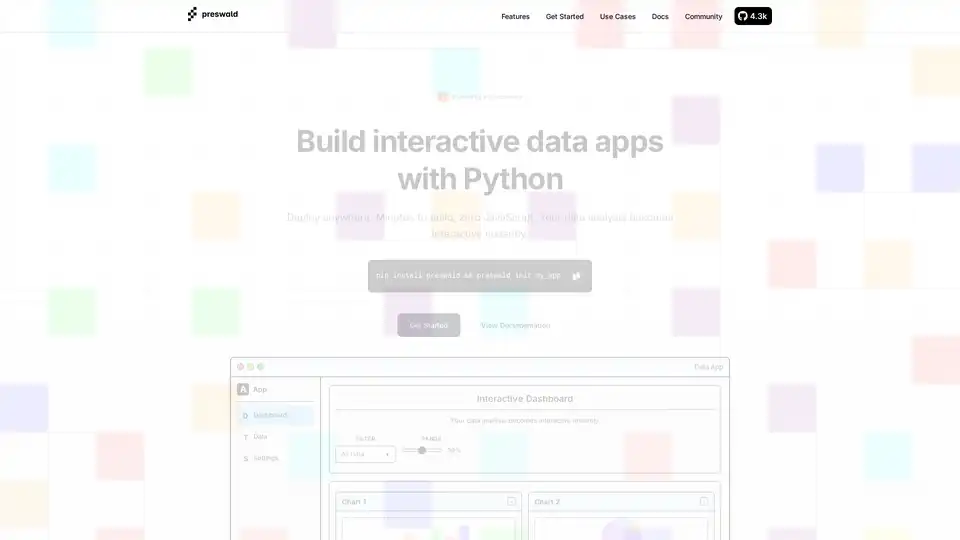
Create interactive data apps with Python using Preswald. Build and deploy static sites for data analysis instantly. No JavaScript needed.
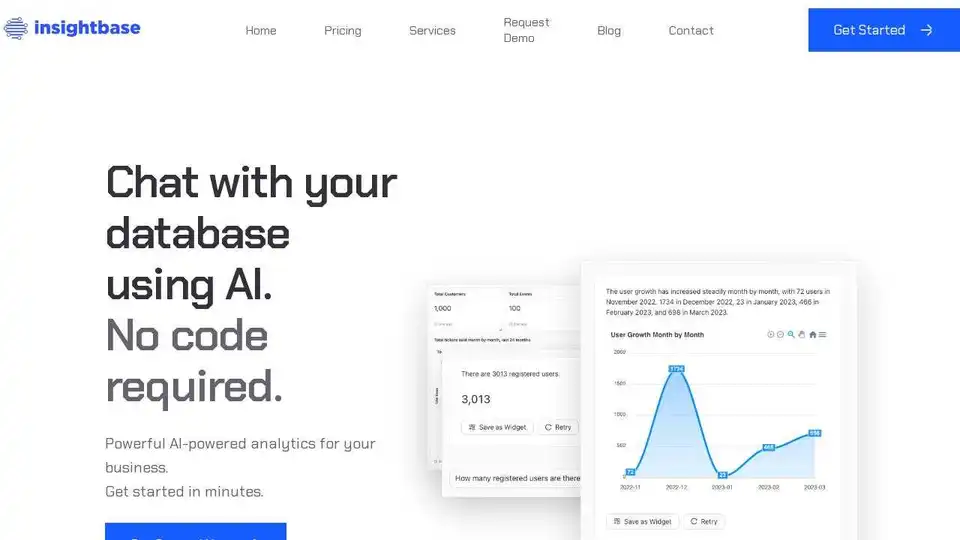
InsightBase is an AI-driven data analytics and business intelligence platform empowering users to extract insights from data without coding. Build dashboards, ask questions in plain English, and monitor data changes.
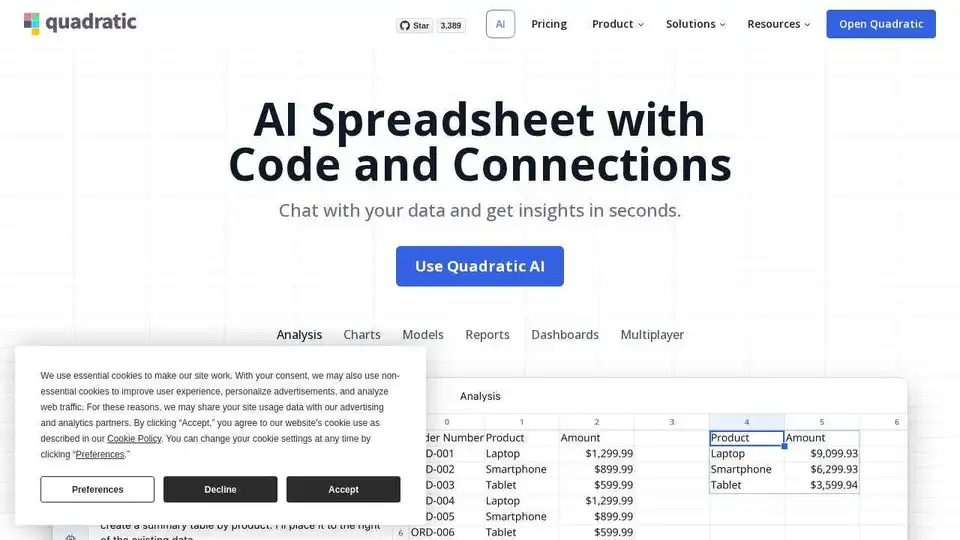
Quadratic: The AI spreadsheet with code and connections. Chat with your data, connect databases, and visualize results.
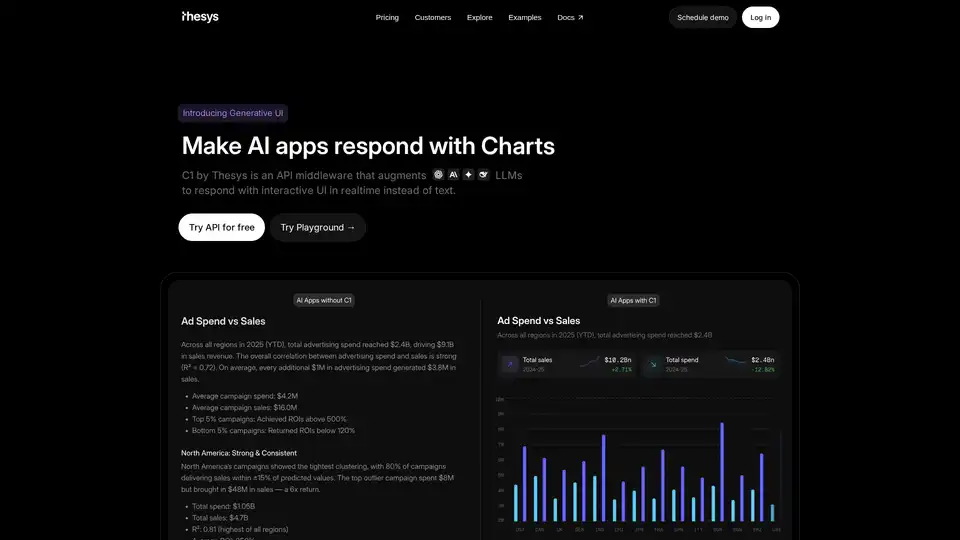
C1 by Thesys is an API middleware that augments LLMs to respond with interactive UI in realtime instead of text, turning responses from your model into live interfaces using React SDK.
Superluminal provides an AI code interpreter API to seamlessly add conversational data interaction to data dashboards. It enables users to extract meaningful insights from data with natural language.
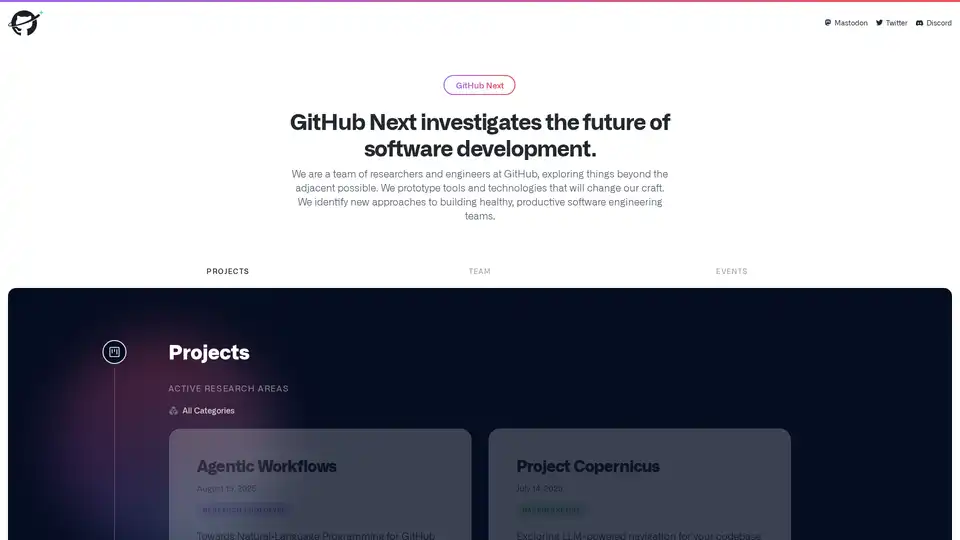
GitHub Next explores the future of software development by prototyping tools and technologies that will change our craft. They identify new approaches to building healthy, productive software engineering teams.

ScrapeTheMap is a powerful Google Maps Scraper for fast, scalable, AI-enhanced lead generation, market analysis, and business intelligence. Turn local data into global profits.
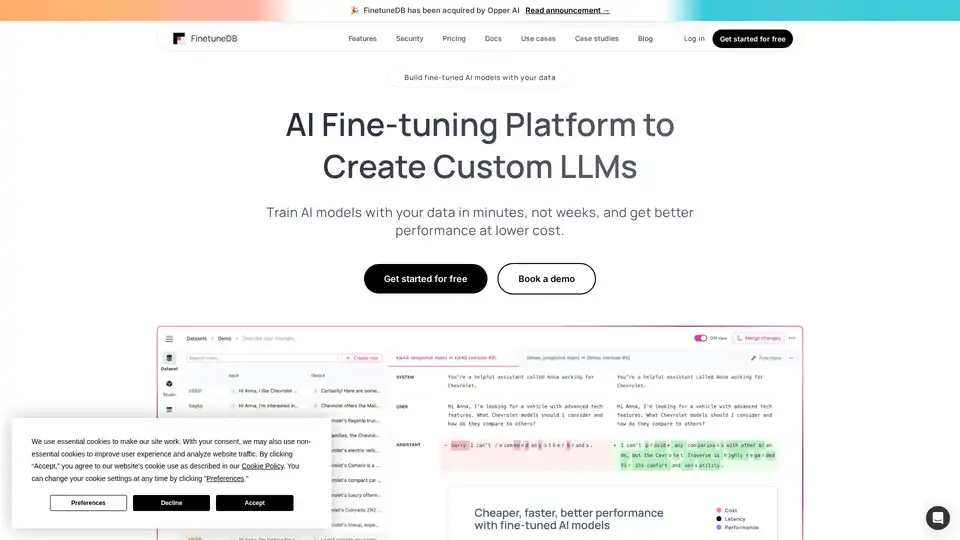
FinetuneDB is an AI fine-tuning platform that lets you create and manage datasets to train custom LLMs quickly and cost-effectively, improving model performance with production data and collaborative tools.
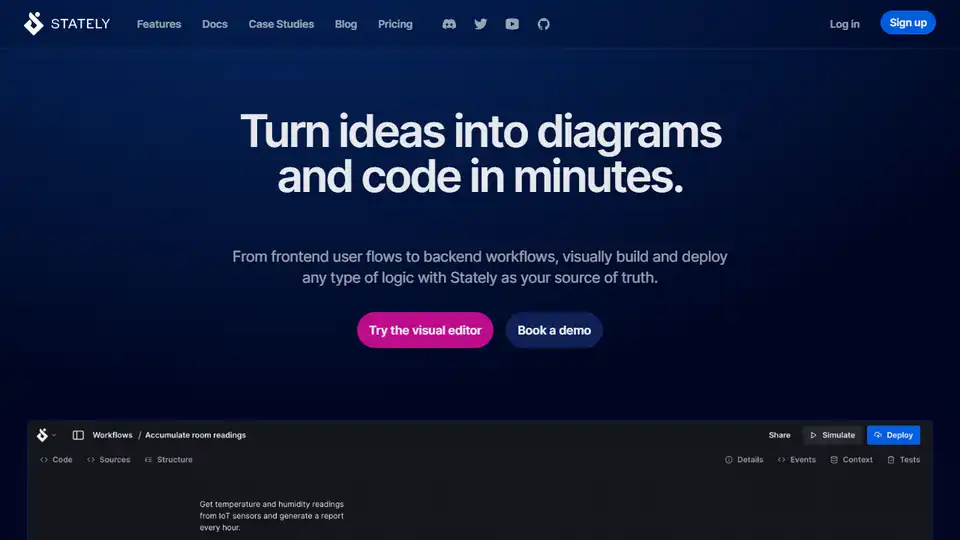
Stately is a visual platform to build and deploy complex app logic and workflows with AI assistance. Design with a drag-and-drop editor, use XState, and deploy to Stately Sky.
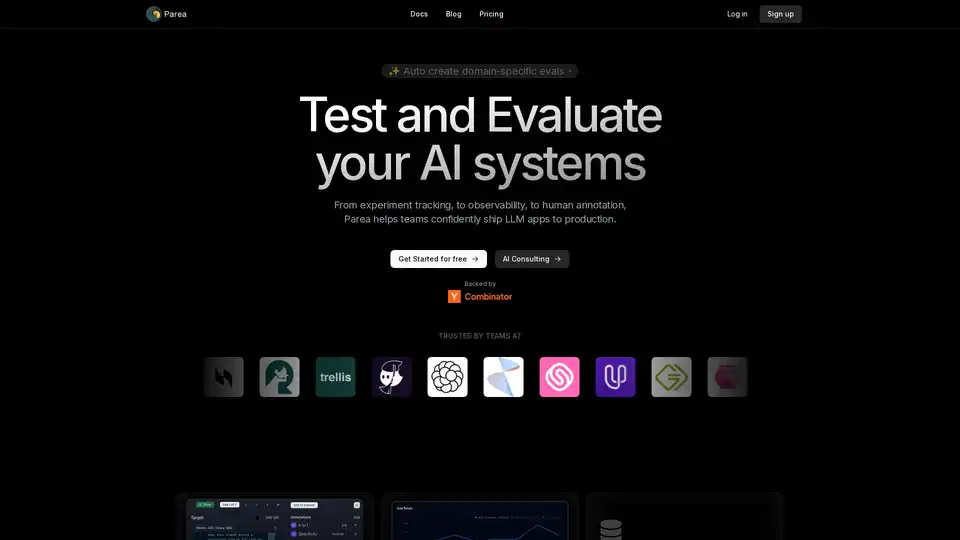
Parea AI is the ultimate experimentation and human annotation platform for AI teams, enabling seamless LLM evaluation, prompt testing, and production deployment to build reliable AI applications.
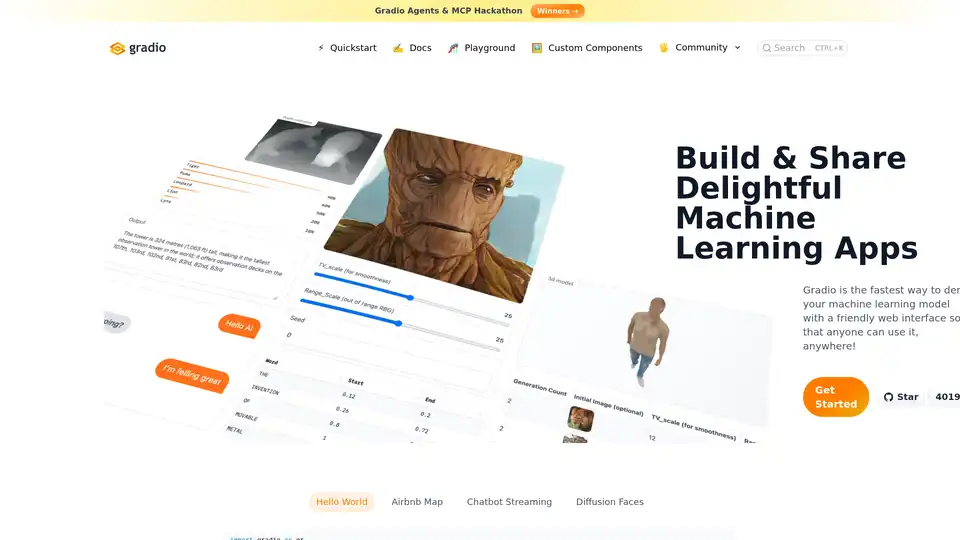
Gradio allows you to quickly create shareable web interfaces for your machine learning models with just a few lines of Python code. It's designed for fast prototyping and easy deployment.
DeepClaude is an open-source tool that merges DeepSeek R1's advanced reasoning with Claude's creativity for seamless AI code generation. Enjoy zero-latency responses, privacy, and customizable APIs—no signup required.
