Bricks
Overview of Bricks
What is Bricks?
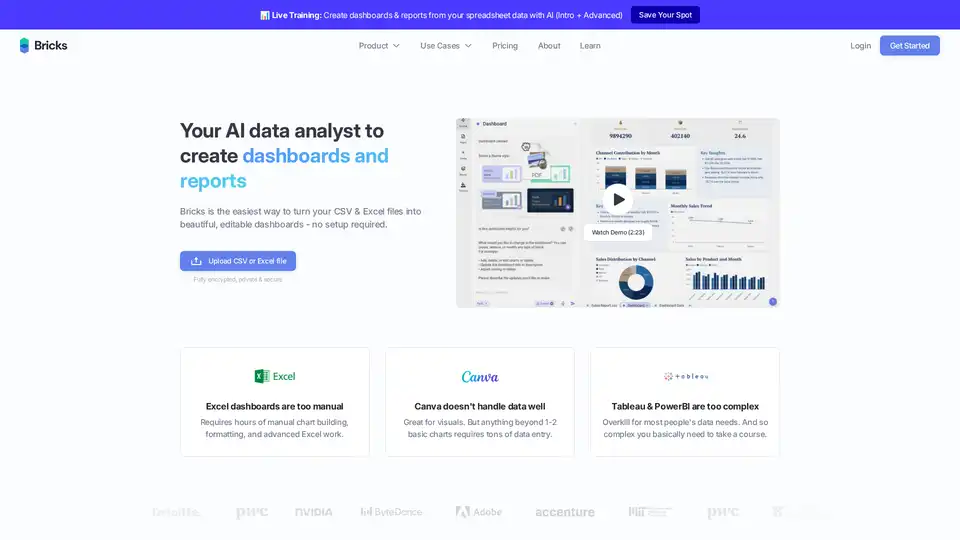
Bricks is an AI-powered data analysis tool designed to transform CSV and Excel files into interactive and visually appealing dashboards and reports. It aims to simplify data analysis for everyone, regardless of their technical skills. By leveraging AI, Bricks automates many manual tasks involved in traditional dashboard creation, making it accessible to a broader audience.
How does Bricks work?
Bricks operates by allowing users to upload their CSV or Excel files directly to the platform. Once the data is uploaded, Bricks uses AI algorithms to automatically generate charts, graphs, and other visualizations. Users can then customize these visualizations, add filters, and adjust the layout to create a dashboard that meets their specific needs. The platform also supports one-click data refreshing, which allows users to update their dashboards with new data while preserving the existing layout.
Key Features of Bricks
- AI-Powered Dashboard Creation: Bricks leverages AI to automatically generate dashboards from CSV and Excel files, reducing the need for manual chart building and formatting.
- User-Friendly Interface: The platform features a drag-and-drop interface that makes it easy for users to customize their dashboards without requiring advanced technical skills.
- One-Click Data Refresh: Users can update their dashboards with new data in just one click, saving time and effort.
- Interactive Filtering: Bricks allows users to filter their data and uncover hidden patterns by clicking on any data point within the dashboard.
- Customizable Templates: Users can save their dashboard layouts as templates and reuse them with fresh data, ensuring consistency and efficiency.
- Professional Themes: The platform offers a variety of professional visual themes that users can apply to their dashboards, eliminating the need for design work.
- Data Security: Bricks prioritizes data privacy and security, using industry-leading data protection measures to encrypt and securely store user data. The data is never used for AI training purposes.
Why Choose Bricks?
Bricks offers a unique combination of simplicity and power, making it an ideal solution for individuals and organizations who need to analyze data but lack the time or expertise to use more complex tools like Tableau or Power BI. The platform's AI-powered features automate many of the manual tasks involved in dashboard creation, while its user-friendly interface makes it accessible to users of all skill levels. Furthermore, Bricks prioritizes data security, ensuring that user data is protected and never used for AI training purposes.
Who is Bricks for?
Bricks is designed for a wide range of users, including:
- Business Professionals: Sales, marketing, HR, finance, customer support, and operations professionals can use Bricks to create dashboards and reports that provide insights into key business metrics.
- Small Businesses and Startups: Bricks is an affordable and easy-to-use solution for small businesses and startups who need to analyze data but lack the resources to invest in more expensive tools.
- Mid-Market and Enterprise Organizations: Bricks can be used by mid-market and enterprise organizations to create dashboards and reports for various departments and teams.
- Data Analysts: Even experienced data analysts can benefit from Bricks' AI-powered features, which can help them automate tasks and create dashboards more quickly.
- Educators and Students: Bricks can be used in educational settings to teach students about data analysis and visualization.
User Testimonials
Here are some testimonials from Bricks users:
- "Wow, what an awesome tool! As someone who creates lots of dashboards for a 1500 employee company, Bricks comes in very handy."
- "I've been struggling for a while trying to use ChatGPT and Claude. Within 20 mins of using Bricks, I've been able to send a dashboard to my client. Awesome!"
- "I was blown away by what you have done here. I teach AI tools at my university, and this is the tool I teach my students regarding AI for data analytics."
- "I really love Bricks AI. It created a dashboard that was exactly (100%) what I needed. Saved me a ton of time. I've been looking for a solution like this for a long time."
Conclusion
Bricks is an AI-powered data analysis tool that makes it easy for anyone to create beautiful, interactive dashboards and reports from CSV and Excel files. Its user-friendly interface, AI-powered features, and focus on data security make it an ideal solution for individuals and organizations who need to analyze data but lack the time or expertise to use more complex tools. By simplifying data analysis and visualization, Bricks empowers users to make better decisions and gain valuable insights into their data. Whether you're a business professional, a student, or a data analyst, Bricks can help you unlock the power of your data.
What is Bricks? It's an AI data analyst that allows you to easily create dashboards and reports. How does Bricks work? Simply upload your CSV or Excel file, and the AI will generate interactive visualizations. Who is Bricks for? It is perfect for anyone who needs to analyze data but lacks the technical skills or time to use more complex tools. Best way to create dashboards? Use Bricks for a user-friendly and efficient experience.
Best Alternative Tools to "Bricks"
Make exploratory data analysis (EDA) easier with AI powered visual analytics. Discover, Analyze and Share data insights with ease.

ExcelDashboardAI transforms Excel files into AI-powered data dashboards and reports in one click. Unlock data insights with AI-driven analysis and visualizations.
Querio: AI-native Business Intelligence platform for querying, analyzing, and reporting data, regardless of technical skill.
Flowtrail AI: Conversational AI data agent for efficient data management. Get instant insights, custom reports, and seamless integrations for data analysis.
Displayr is an AI-powered analysis and reporting solution transforming data into strategy in minutes. It integrates data, analysis, visualizations, and reports, automating workflows and enhancing insights.
Coefficient connects Google Sheets & Excel to 100+ business systems, enabling live data syncing, automated refreshes, and AI-powered insights for streamlined reporting and data analysis.
Quills AI: AI-powered platform for data analysis & visualization, generating SQL queries through natural language. Boost data-driven decisions and integrate with Slack.
Syft Analytics is an AI-first financial reporting platform used by thousands of organizations for dashboards, consolidations, forecasts, and reports, enabling better business decisions.
Graphy is an AI-powered graph maker that simplifies data storytelling. Create stunning data visualizations from messy data in a click. Trusted by 300,000+ users.

ReadPartner is a media intelligence platform consolidating media monitoring, data analysis, and department briefing into one dashboard. Monitor news, social media, and trends with AI.
DataSquirrel.ai: Fast, safe AI-powered data analysis for business. Auto-clean, analyze, visualize & share data. No formulas or pivot tables needed.
Dot is an AI data analyst that empowers teams to get instant, actionable insights from their data. Connect to Slack or Teams for fast, trustworthy answers.
Reqi is an intuitive online requirements management platform for systems engineering, powered by AI assistant REX. It simplifies collaboration, traceability, and risk management across teams and supply chains, ensuring efficient project delivery.
Avanzai empowers asset managers with AI-driven workflow automation. Our agents leverage your data and tools to streamline report generation, risk alerts, scenario analysis, and insights—accelerating decision-making in today's dynamic financial markets.