Grapha.ai
Overview of Grapha.ai
What is Grapha.ai?
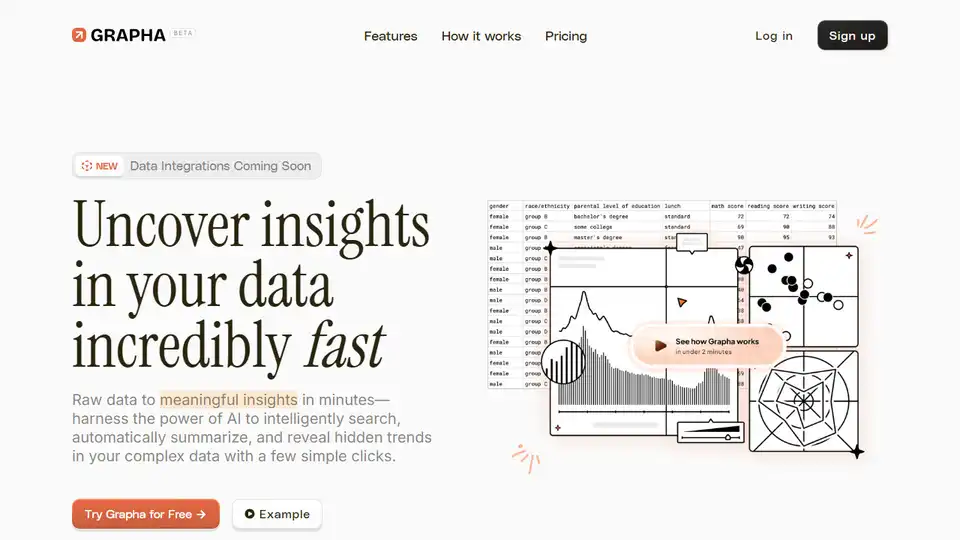
Grapha.ai is an AI-powered data exploration tool designed to help users uncover hidden trends and patterns in their complex data. It acts as a data science copilot, turning raw data into meaningful insights quickly and effortlessly.
Key Features:
- AI-Assisted Storytelling: Transforms complex datasets into clear, actionable insights.
- Stunning Visualizations: Offers various visualization types, with new ones added regularly.
- Sound Data Practices: Built on proven data science practices for reliable analysis.
- User Data Control: Allows users to share and manage their data on their own terms, with privacy and ownership as priorities.
- Copilot Command: Enables users to ask questions without code or formulas.
- Export Views: Simplifies exporting the clean, aggregated data underlying visualizations.
How to Use Grapha.ai?
- Data Upload: Upload your data in CSV, Excel, or Google Sheets format.
- Ask Questions: Use the AI copilot to ask questions about your data.
- Explore Insights: Grapha.ai intelligently searches, automatically summarizes, and reveals hidden trends.
- Visualize Data: Choose from a variety of visualization types to share your findings.
Pricing:
Grapha.ai offers two upgrade options:
- Grapha Prime (Yearly): $120/year (launch offer, usually $145).
- Grapha Prime (Monthly): $11.99/month.
Grapha Prime includes unlimited datasets per month, questions per month, dataset & report retention, data integrations, early access to new features, and email support.
Why is Grapha.ai Important?
Grapha.ai is important because it democratizes data analysis. It allows anyone, regardless of their technical expertise, to quickly and easily extract insights from their data. This can lead to better decision-making, improved business outcomes, and a deeper understanding of the world around us.
Where can I use Grapha.ai?
You can use Grapha.ai in a variety of industries and for a variety of purposes, including:
- Business: Analyze sales data, customer data, marketing data, and more.
- Research: Explore scientific data, social science data, and more.
- Education: Teach data analysis skills to students.
- Personal: Track your fitness data, financial data, and more.
Best Alternative Tools to "Grapha.ai"
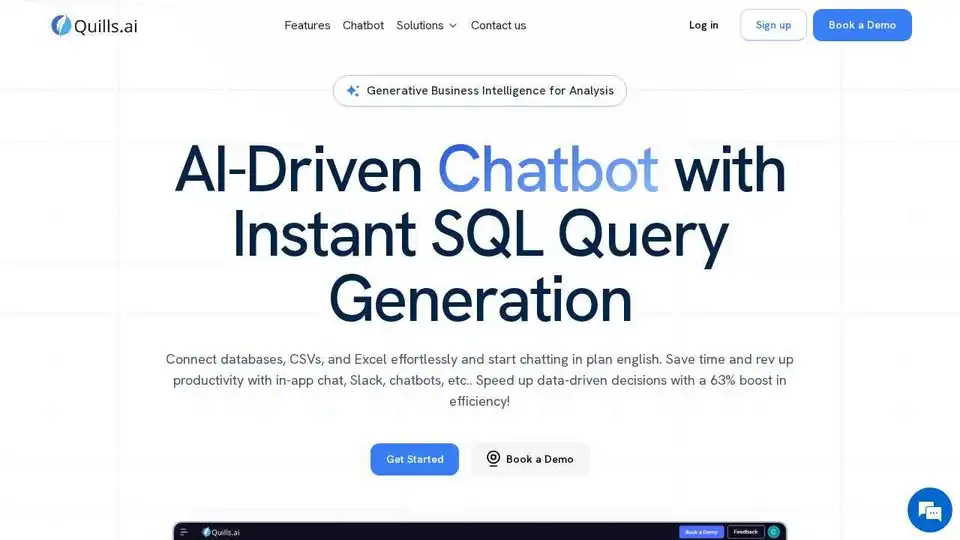
Quills AI: AI-powered platform for data analysis & visualization, generating SQL queries through natural language. Boost data-driven decisions and integrate with Slack.
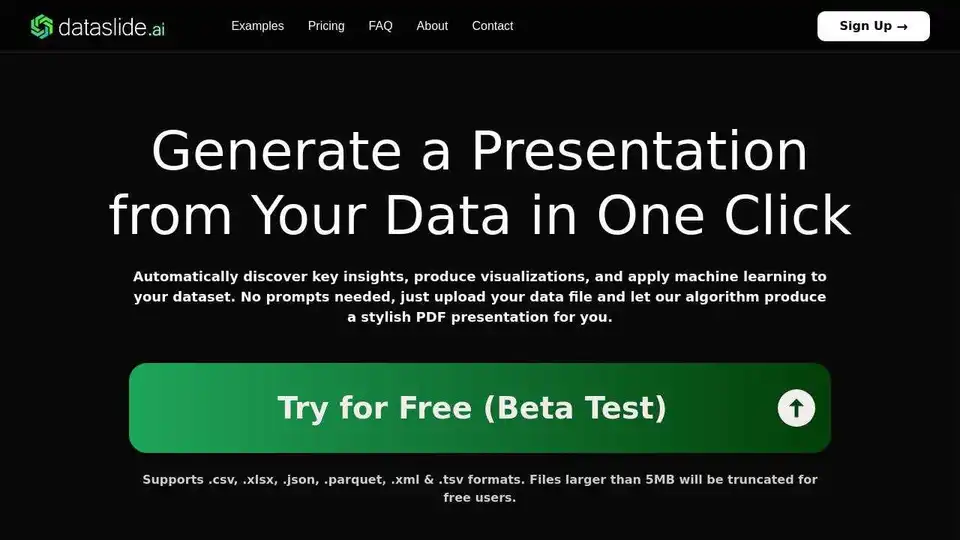
Dataslide.ai automatically generates stylish PDF presentations from your data. Upload your data file and let AI discover key insights, produce visualizations, and apply machine learning. Supports .csv, .xlsx, .json, etc.
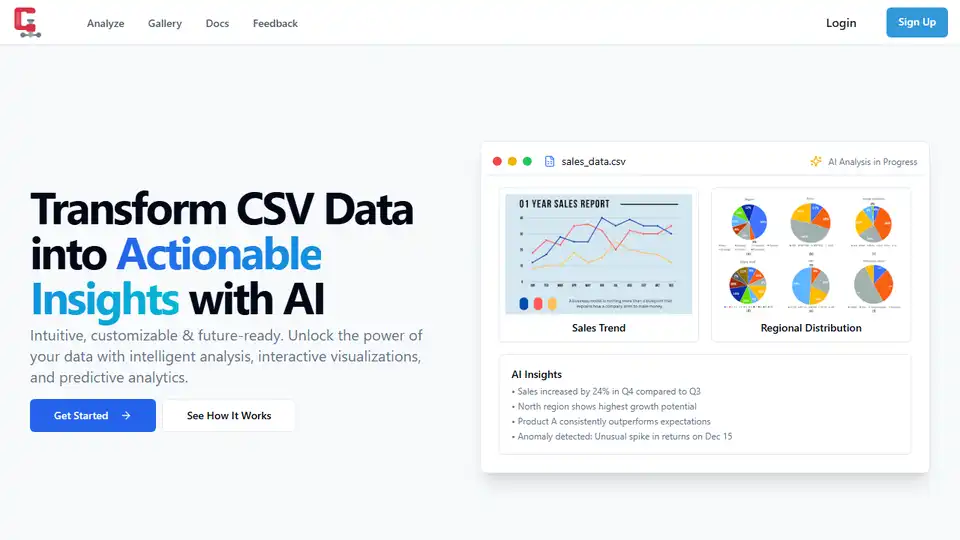
Transform CSV Data into Actionable Insights with AI. DropCSV offers AI-powered analysis, interactive visualizations, and predictive intelligence for effortless data exploration.
Data on Demand uses Generative AI to simplify data analysis and visualization, enabling faster business decisions. Extract insights, analyze trends, and create compelling visuals effortlessly.
SheetBot AI is an AI data analyst tool designed to streamline data visualization and analysis. Automate data work and generate precise graphs in seconds without code.
Hex is the AI-powered analytics workspace designed for teams to drive faster answers, better decisions, and collaborative data exploration with notebooks, apps, and self-serve tools.
Powerdrill is an AI-powered data analysis tool for fast, insightful data exploration. Generate reports, visualize trends, and clean data without coding. Try it free!
Livedocs is your AI data scientist, a collaborative workspace that combines the power of notebooks with the simplicity of an app builder. Use it for data exploration, visualization, and machine learning.
PredictEasy is a no-code AI-powered data analytics platform for effortless data exploration, visualization, and machine learning. Discover actionable insights and grow your business.
DataLine is an AI-driven, open-source data exploration platform that prioritizes your privacy. Analyze and visualize your data securely on your device without cloud storage.
Datatalk: AI-powered solution for data interaction, visualization, and real-time insights. Chat with your data, generate graphics, and perform intelligent web scraping.
Make exploratory data analysis (EDA) easier with AI powered visual analytics. Discover, Analyze and Share data insights with ease.
Arcwise is an AI-powered data analyst that integrates directly into Google Sheets, enabling anyone to perform in-depth data analysis, explore trends, and visualize insights with ease.
VisActor, derived from ByteDance, provides intelligent visualization solutions including rendering engine, visualization grammar, and chart components for narrative-oriented data storytelling.
Explore your tabular data with AI, the AI for Data Science, the AI can understand complex patterns in visualizations.