VisActor
Overview of VisActor
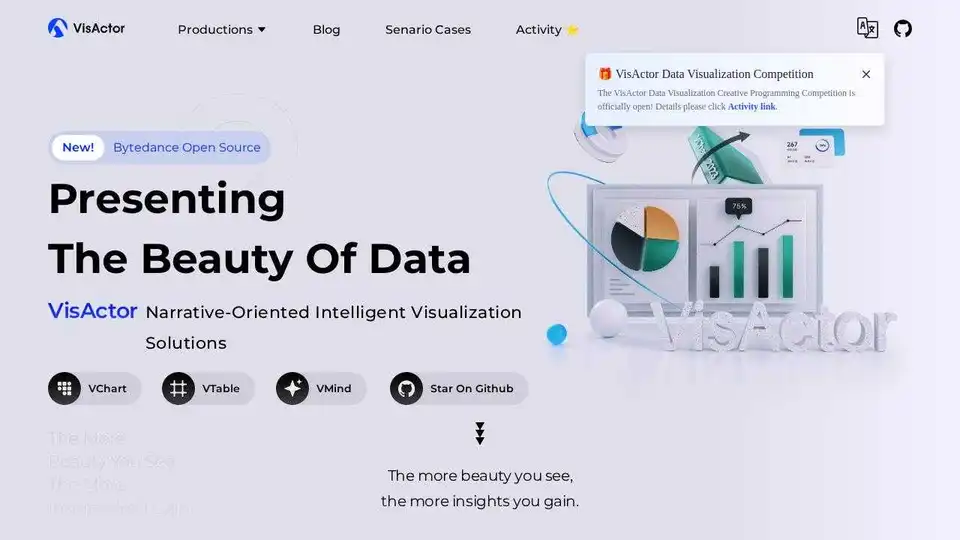
VisActor: Narrative-Oriented Intelligent Visualization Solutions
What is VisActor? VisActor is an open-source visualization solution originating from ByteDance, designed to transform raw data into compelling, narrative-driven visual stories. It combines traditional visualization techniques with a focus on narrative and intelligent features, enabling users to gain deeper insights from their data.
How does VisActor work? VisActor comprises several key modules working in concert:
- VChart: A versatile chart library for creating a wide range of visualizations.
- VTable: A high-performance, multi-dimensional data analysis form for grid-based data exploration.
- VGrammar: A visual grammar that empowers users to generate thousands of chart types, turning complex data into visually appealing representations.
- VRender: A feature-rich visual rendering engine for creating interactive and dynamic visualizations.
- VMind: Smart visualization suite.
- VStory: Story Weaver who skillfully blends data and narrative.
Key Features and Benefits
- Narrative Visualization: VisActor prioritizes the creation of data stories, enabling users to communicate insights more effectively.
- Intelligent Visualization: Aims to provide smart, automated visualization capabilities to simplify data analysis.
- Versatile Chart Library: The VChart library offers a wide array of chart types to suit various data visualization needs.
- High Performance: Designed for optimal rendering performance across multiple platforms.
- Customizable: Chart styles, layouts, and animations can be customized to meet specific requirements.
Usage Scenarios
VisActor can be applied across diverse scenarios:
- Large Screen Visualization: Create impressive data dashboards with rich chart types, dynamic updates, and smooth rendering.
- Business Intelligence (BI): Customize charts and layouts, and leverage built-in data analysis features for comprehensive BI solutions.
- Office Suite: VisActor's compatibility and performance make it suitable for use within office applications.
How to Get Started
To start using VisActor, explore the available resources:
- GitHub: Access the source code and contribute to the project.
- Examples: Review scenario cases.
Community and Support
- Github: Star On Github
- E-Mail: Contact Information
- Discord: Contact Information
- Lark: Contact Information
VisActor empowers users to see the beauty in data, fostering deeper insights and enabling more effective communication. It is not just a tool, but also a Story Weaver who skillfully blends data and narrative.
Best Alternative Tools to "VisActor"
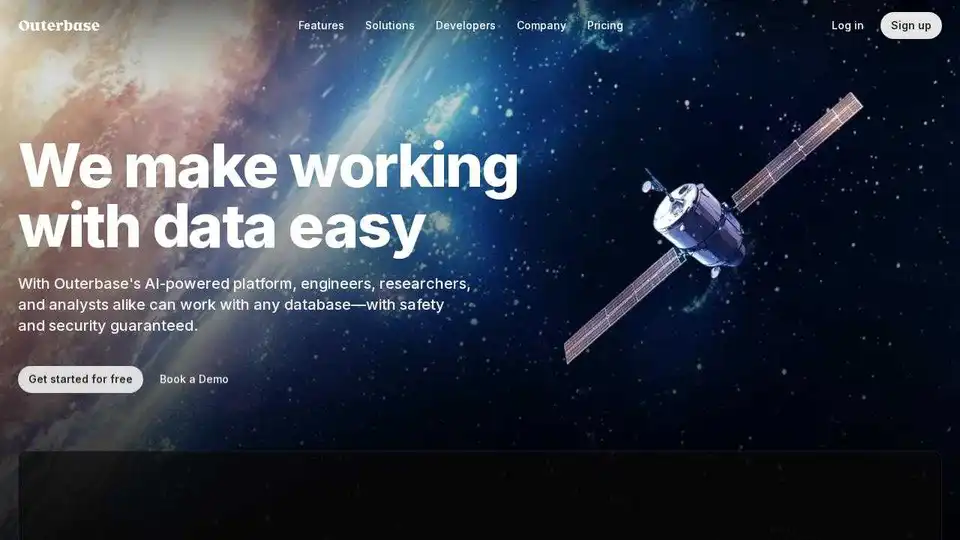
Effortlessly manage and explore your database with AI. Outerbase provides an AI-powered platform for engineers, researchers, and analysts to work with any database safely and securely.
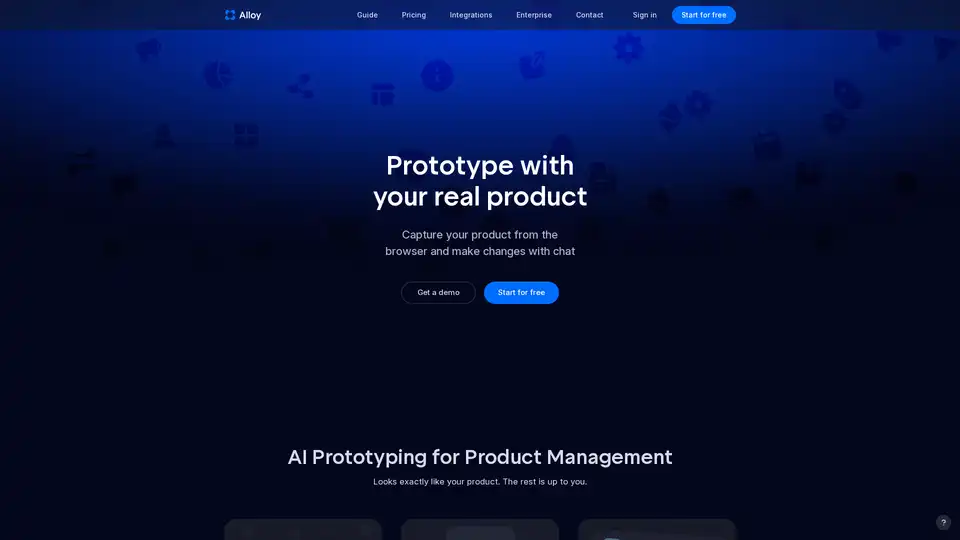
The world's first tool for prototypes that look exactly like your product. Capture your product from the browser instantly and build lifelike, interactive prototypes to share with your team and customers.
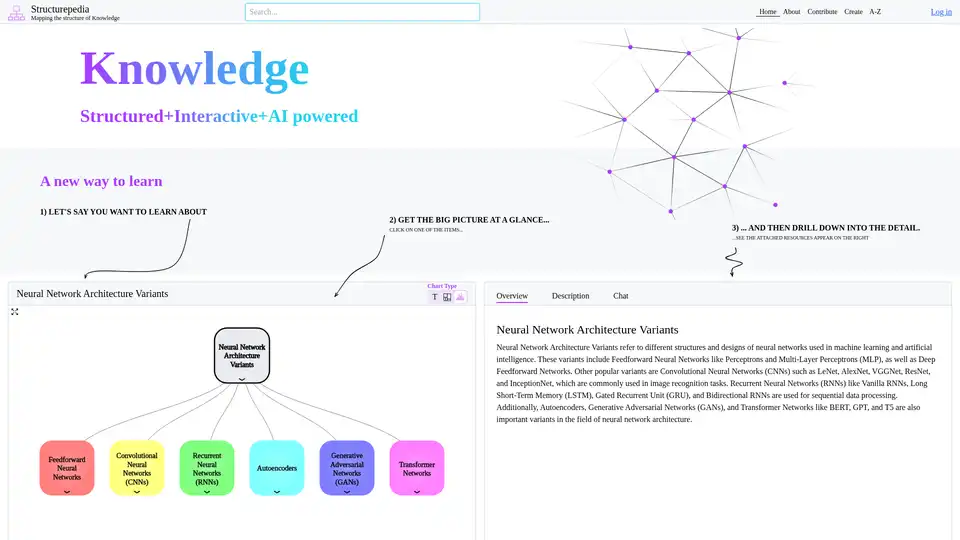
Discover Structurepedia, an AI-powered platform for visual web search and interactive knowledge trees. Explore complex topics like neural networks with structured diagrams and resources for free, enhancing learning efficiency.
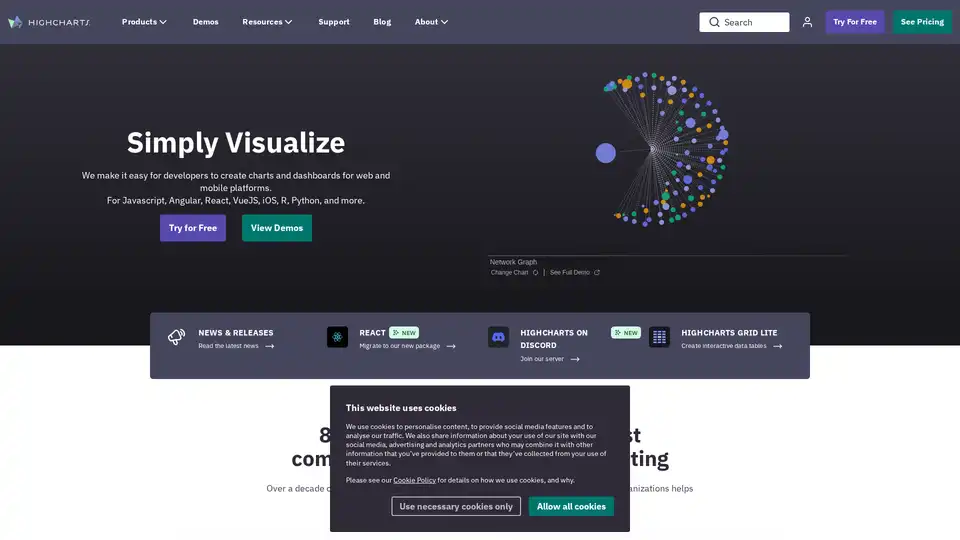
Highcharts is a JavaScript charting library for creating interactive data visualizations for web and mobile. It supports various platforms and languages including Angular, React, Python, and more.

Excelmatic is an AI-powered tool that simplifies Excel data analysis and visualization. Upload your Excel file, ask questions in plain English, and get instant insights and charts without needing complex formulas.
EdrawMax is a versatile diagramming tool that allows users to create over 210 types of diagrams, including flowcharts, mind maps, and org charts. It also features AI-powered generation and beautification of designs.
Create TradingView PineScript indicators and strategies in minutes with our creator. Best TradingView premium code ai generator and DIY strategy builder.
FactBox.AI: Effortlessly create, share, and manage financial factsheets with customizable layouts, CSV data import, and advanced widgets for impactful data visualization. Try it now!
Memento Database is a powerful AI-enabled data management tool for businesses & personal use. Organize, analyze, & visualize data across platforms with ease.
Chat with AI using your API keys. Pay only for what you use. GPT-4, Gemini, Claude, and other LLMs supported. The best chat LLM frontend UI for all AI models.
InfographAI is a free AI infographic generator that instantly converts articles, blog posts, PDFs, or text into stunning, customizable visuals. Create eye-catching infographics in seconds!
Generate professional diagrams instantly with Diagramming AI. Supports UML, process flows, Mermaid, PlantUML, GraphViz & Excalidraw. Describe your vision and let AI handle the rest.
SEEKER is a secure, trustworthy AI platform for enterprise content, offering transparent, verifiable insights. It allows users to chat with their content, create documents, and analyze data efficiently.
Build AI-powered chatbots with NewRA using your enterprise data. Automate responses, enhance customer service, and streamline sales processes. Try it free!