AI Graph Maker
Overview of AI Graph Maker
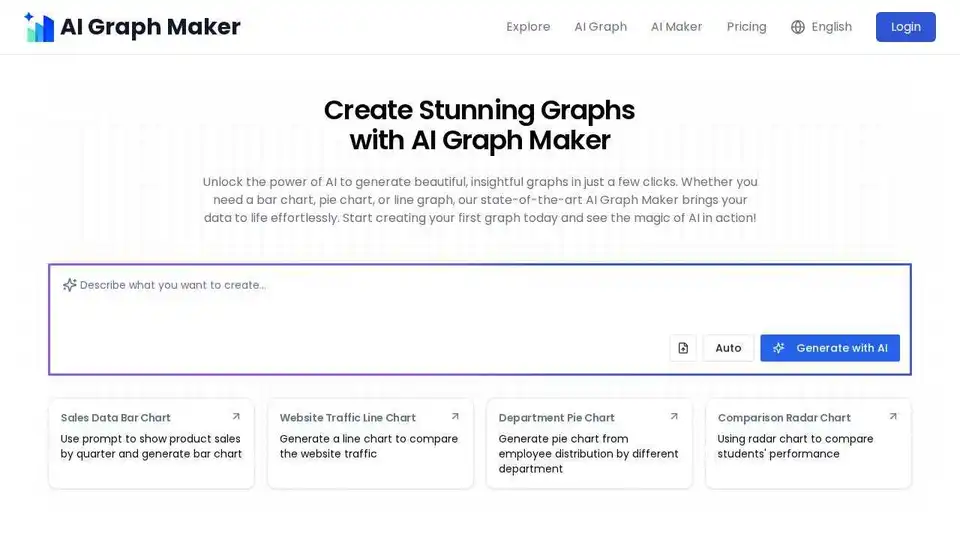
AI Graph Maker: Create Stunning Data Visualizations with AI
What is AI Graph Maker?
AI Graph Maker is an innovative AI-powered tool designed to transform raw data into visually appealing and insightful graphs in seconds. Whether you're a business professional, student, or researcher, AI Graph Maker simplifies the process of data visualization, making it accessible to everyone.
How does AI Graph Maker work?
AI Graph Maker leverages the power of artificial intelligence to automate the graph creation process. Simply input your data, either manually or through file upload, and the AI algorithms will analyze the data and generate appropriate graph types. You can further customize the generated graphs to match your specific needs.
Key Features
- AI-Generated Charts: Generate high-quality charts automatically using AI-driven automation.
- Chart Diversity: Supports multiple chart types including bar charts, pie charts, line graphs, mind maps, and more.
- Visual Adjustment: Offers a user-friendly interface for intuitive customization.
- Multi-format Export: Export your charts in various formats such as PNG, SVG, or Mermaid.
- Responsive Design: Ensures seamless visualizations across all devices.
Supported Chart Types
AI Graph Maker supports a wide variety of chart types, catering to different data visualization needs:
- Pie Chart
- Line Chart/Racing Line Chart
- Bar Chart/Racing Bar Chart
- Sunburst
- Stacked Bar
- Funnel
- Radar
- Treemap
- Timeline
- Knowledge Graphs
- Gantt Chart
- Flowchart
- Sankey
- C4 Diagrams
- Mind map
- Scatter plot
- Git Graph
- Mindmap
- Kanban
- User Journey
Use Cases
- Sales Data Analysis: Visualize product sales by quarter using bar charts.
- Website Traffic Monitoring: Compare website traffic trends using line charts.
- Employee Distribution: Represent employee distribution across departments using pie charts.
- Performance Comparison: Compare student performance using radar charts.
Benefits of Using AI Graph Maker
- Saves Time: Automates the chart creation process, saving you valuable time and effort.
- Easy to Use: User-friendly interface makes data visualization accessible to everyone.
- Enhances Understanding: Transforms raw data into visually appealing and insightful graphs.
- Improves Communication: Helps you communicate data effectively to your audience.
AI Graph Maker is your go-to solution for creating stunning data visualizations with ease. Try it today and unlock the power of AI to bring your data to life!
AI Task and Project Management AI Document Summarization and Reading AI Smart Search AI Data Analysis Automated Workflow
Best Alternative Tools to "AI Graph Maker"
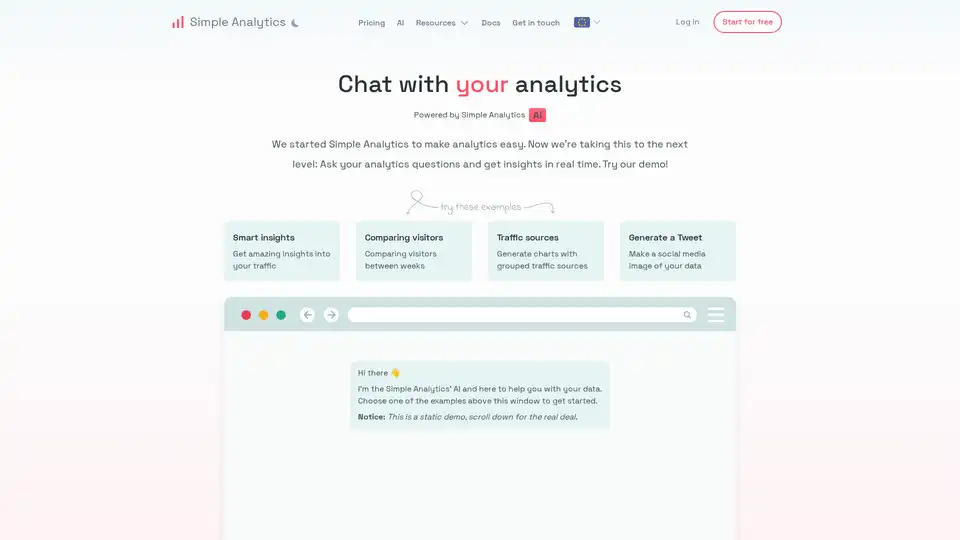
Chat with your analytics data and generate insights and beautiful charts.
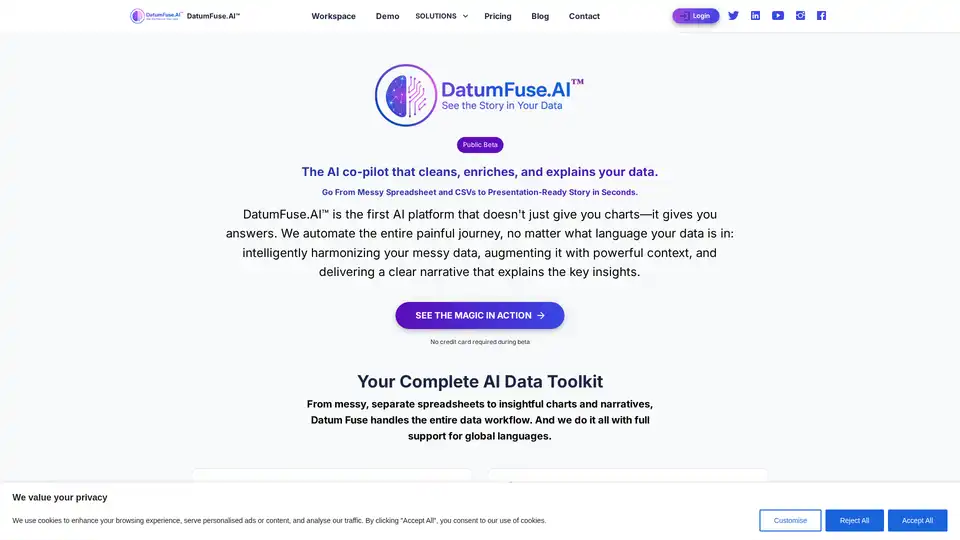
DatumFuse.AI™ is an AI platform that transforms messy spreadsheets and CSVs into presentation-ready stories. It cleans, enriches, and explains data, offering AI-powered visualization, data harmonization, and SEO keyword research.

ChartFast is an AI data analyst tool that automates data visualization and analysis. It generates precise graphs in seconds, saving time and resources for data professionals.

Create professional presentations in minutes with AI Presentation Maker, a free online AI PPT generator. Convert text to presentations effortlessly, ideal for business, education, and creative projects.