GitHub Data Explorer
Overview of GitHub Data Explorer
What is GitHub Data Explorer?
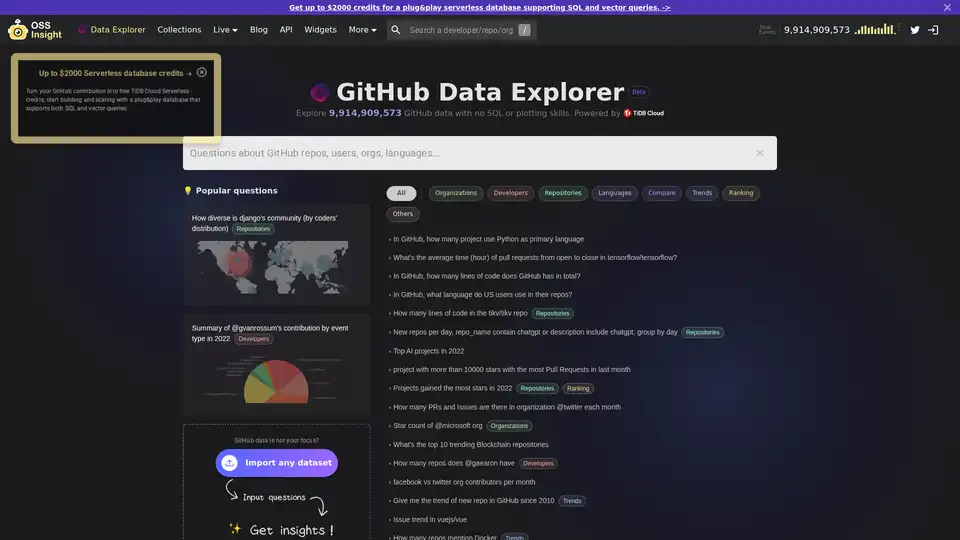
GitHub Data Explorer is a powerful AI-driven tool designed to simplify the analysis of GitHub event data. Hosted on OSS Insight, it allows users to uncover valuable insights from billions of GitHub events without needing SQL expertise or plotting skills. By leveraging natural language processing, you can simply describe what you're looking for, and the tool generates the appropriate SQL query, executes it against a massive dataset, and delivers visually compelling results. This makes it an invaluable resource for developers, data analysts, and open-source enthusiasts who want to track trends, contributions, and repository activities effortlessly.
Whether you're curious about the diversity of a community's coders, the contribution patterns of key figures like Guido van Rossum, or the growth of AI projects on GitHub, GitHub Data Explorer turns complex data exploration into an intuitive conversation. It's built on reliable data sources like GH Archive, ensuring you're working with public GitHub data dating back to 2011, updated in real-time via the GitHub event API.
How Does GitHub Data Explorer Work?
The workflow of GitHub Data Explorer is straightforward and user-friendly, powered by cutting-edge AI technologies. Here's a step-by-step breakdown:
Input Your Question: Start by typing a natural language query into the search box. For example, "How many new repos mention ChatGPT per day?" or "What's the trend of Rust repositories over the past 10 years?" The tool suggests popular questions to inspire your searches, covering topics like repositories, developers, organizations, languages, trends, and rankings.
AI Translation to SQL: Behind the scenes, the AI engine—built on OpenAI's ChatGPT API—interprets your question and translates it into precise SQL code. This Text2SQL capability handles the nuances of GitHub's data structure, querying against a backend powered by TiDB Cloud, a scalable, fully managed database that supports massive volumes (over 5 billion events) and complex analytical workloads.
Query Execution and Visualization: The generated SQL runs on the TiDB Cloud database, pulling real-time or historical data from GH Archive and the GitHub API. Results are then visualized using Apache ECharts, presenting charts, trends, and summaries that are easy to interpret. No manual coding or data wrangling required.
This process ensures efficiency and accuracy, though it's worth noting that AI is an evolving technology. For best results, use clear, specific phrasing tied to GitHub terminology—like full repository names (e.g., "facebook/react") or exact user handles (e.g., "torvalds" instead of "Linus").
Key Features and Capabilities
GitHub Data Explorer stands out with its robust feature set tailored for OSS (open-source software) analysis:
Diverse Query Categories: Explore repositories (e.g., lines of code in specific projects like tikv/tikv), developers (e.g., contributor rankings for facebook/react), organizations (e.g., PRs and issues in @twitter monthly), languages (e.g., US users' preferred repo languages), trends (e.g., new repos since 2010), and more.
Popular Pre-Built Queries: Jumpstart your analysis with ready examples, such as "Top AI projects in 2022" or "Star count trends for @microsoft org." These highlight high-impact insights like blockchain repository rankings or the rise of Python as a primary language.
Custom Dataset Integration: Beyond GitHub, you can import any dataset using the integrated Chat2Query feature in TiDB Cloud, extending its utility to broader data exploration needs.
Real-Time and Historical Data: Combines streaming updates from the GitHub event API with archived data from 2011 onward, providing a comprehensive view of OSS evolution.
Visual Outputs: Results aren't just raw data—they're transformed into interactive charts, graphs, and summaries for quick comprehension.
The tool's backend, TiDB Cloud, excels at handling high-volume, mixed workloads, making it ideal for scaling as GitHub's ecosystem grows.
Practical Use Cases and Applications
GitHub Data Explorer shines in various scenarios where understanding OSS dynamics is crucial:
Trend Analysis for Developers: Track the popularity of technologies, like the monthly growth of repos mentioning Docker or the MoM (month-over-month) trends in Rust adoption. This helps developers identify emerging tools and languages.
Community and Contribution Insights: Analyze contributor diversity in projects like Django or compare organizations like Facebook vs. Twitter in terms of monthly contributors. It's perfect for gauging community health.
Project Benchmarking: For repository owners, query metrics like average pull request resolution time (e.g., in tensorflow/tensorflow) or total stars gained in a year to benchmark against peers.
Research and Reporting: Academics or analysts can generate data on AI project surges, such as repos with over 10,000 stars and high PR activity, fueling reports on OSS innovation.
Marketing and Business Intelligence: Organizations can monitor their GitHub footprint, like @gaearon's repo count or @microsoft's star trends, to inform strategy.
In essence, it's a go-to for anyone needing quick, AI-assisted dives into GitHub's vast data lake without the overhead of traditional analytics tools.
Who is GitHub Data Explorer For?
This tool is designed for a wide audience, particularly those without deep technical backgrounds in databases or visualization:
Non-Technical Users: Marketers, product managers, or journalists who want OSS insights but lack SQL skills.
Developers and Data Analysts: Busy professionals seeking rapid prototyping of queries for trends, rankings, or comparisons.
OSS Enthusiasts and Researchers: Contributors tracking project momentum or studying language adoption patterns.
Teams Using TiDB Cloud: Integrates seamlessly, appealing to users already in the PingCAP ecosystem.
Limitations exist—AI may struggle with highly complex or ambiguous queries due to context gaps or domain knowledge shortfalls, and the dataset is limited to public GitHub events. Service instability or rate limits (15 questions/hour) can occur, but optimizations like using suggested templates mitigate these.
Why Choose GitHub Data Explorer?
In a sea of analytics tools, GitHub Data Explorer differentiates itself with its specialized focus on GitHub data, AI simplicity, and enterprise-grade backend. Unlike manual SQL writing or generic BI tools, it democratizes access to OSS intelligence, saving hours of setup. Backed by technologies like React, TypeScript, and Docusaurus, it's reliable and user-centric.
Users appreciate the feedback loop: share suggestions via Twitter (@OSSInsight) or email to help refine it. For deeper dives, check related resources like the "How OSS Insight Works" blog or TiDB Cloud tutorials.
If you're exploring GitHub's pulse— from issue trends in vuejs/vue to total lines of code across the platform—GitHub Data Explorer is your best starting point. Try it today on OSS Insight and transform natural curiosity into actionable insights.
Best Alternative Tools to "GitHub Data Explorer"
Boost SaaS growth with UniBee's AI-powered financial analytics. Real-time metrics, churn prevention, and pricing insights for smart decisions.
Rapidwork is an AI-powered platform with tools like Datafetch for queries, PDFsense for document analysis, and Designbox for graphics creation, helping users boost productivity in design and research tasks.
Soverin is the ultimate AI marketplace for discovering, buying, and leveraging top AI apps and agents. Automate over 10,000 tasks, from building agents to scaling customer support, and boost productivity with trending automation tools.
Import docs, websites, PDFs, GitHub, Zendesk, Jira, Confluence, and videos to create your own AI Q&A assistant. Embed it anywhere or self-host it. Used by 130+ projects.
Transform complex data analysis with Fabi.ai's all-in-one AI platform. Combine SQL, Python, and AI automation for faster insights, dashboards, and workflows from your data sources like Google Sheets and warehouses.
Litlyx is a privacy-first, AI-native web analytics tool that's fully GDPR-compliant without cookies. Track visits, events, and gain actionable insights as a simple alternative to Google Analytics.
Make exploratory data analysis (EDA) easier with AI powered visual analytics. Discover, Analyze and Share data insights with ease.
GitHub Copilot is an AI-powered coding assistant that integrates into your IDE, suggesting code lines, handling issues via agent mode, and providing reviews to boost developer productivity.
Hex is the AI-powered analytics workspace designed for teams to drive faster answers, better decisions, and collaborative data exploration with notebooks, apps, and self-serve tools.
Discover DataChain, an AI-native platform for curating, enriching, and versioning multimodal datasets like videos, audio, PDFs, and MRI scans. It empowers teams with ETL pipelines, data lineage, and scalable processing without data duplication.
FiftyOne is the leading open-source visual AI & computer vision data platform trusted by top enterprises to maximize AI performance with better data. Data Curation, Smarter Annotation, Model Evaluation.
CodeSquire is an AI code writing assistant for data scientists, engineers, and analysts. Generate code completions and entire functions tailored to your data science use case in Jupyter, VS Code, PyCharm, and Google Colab.
Dust is an AI platform that allows businesses to build custom AI agents, connect to company data, automate workflows, and improve productivity. Trusted by 1,000+ organizations.
NeoBase is an AI Copilot for Database that lets you query, analyze, and manage databases with natural language. Supports PostgreSQL, MySQL, MongoDB, and more. Open-source and self-hosted.