Instachart
Overview of Instachart
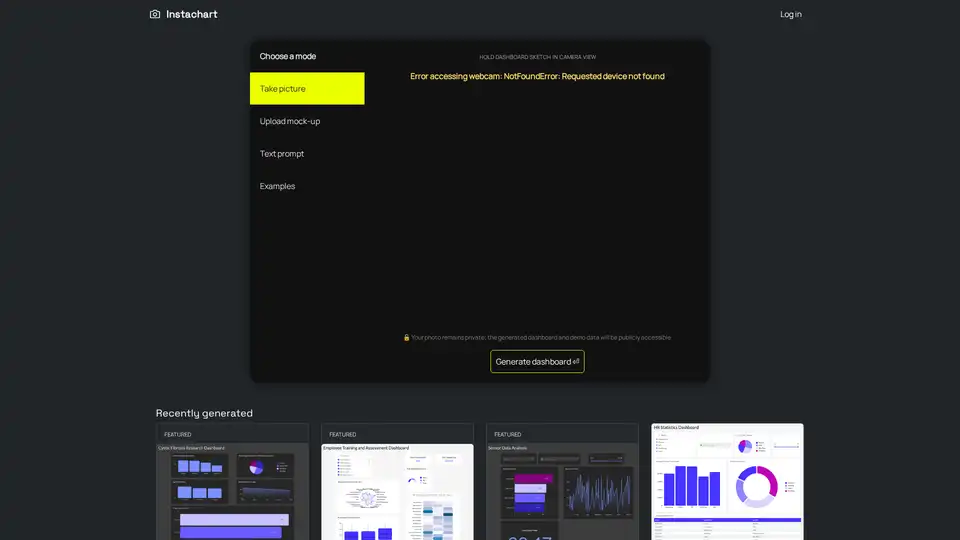
Instachart: Transform Your Dashboard Ideas into Interactive Reality
What is Instachart? Instachart is a tool that allows you to transform your dashboard sketches, mockups, and screenshots into interactive Luzmo dashboards instantly. It provides a quick and easy way to visualize your data from mockups, making it easier to understand and analyze.
How does Instachart work?
Instachart offers multiple modes to generate dashboards:
- Take Picture: Hold your dashboard sketch in the camera view, and Instachart will convert it into an interactive dashboard.
- Upload Mock-up: Upload an existing mockup or screenshot of your dashboard design.
- Text Prompt: Use a text prompt to describe the dashboard you want to generate.
Key Features:
- Instant Transformation: Quickly converts sketches and mockups into interactive dashboards.
- Multiple Input Modes: Supports image capture, mockup upload, and text prompts.
- Powered by Luzmo: Integrates with Luzmo for creating interactive visualizations.
Who is Instachart for?
Instachart is suitable for:
- Data Analysts looking to quickly prototype and visualize data.
- Designers who want to create interactive dashboards from their designs.
- Businesses seeking to gain insights from their data in an easy-to-understand format.
Why choose Instachart?
- Efficiency: Turn your dashboard ideas into interactive dashboards in minutes.
- Ease of Use: Simple and intuitive interface for quick dashboard generation.
- Visualization: Enables better data comprehension through interactive visualizations.
- Privacy: Although the generated dashboard and demo data will be publicly accessible your photo remains private.
Examples:
Instachart features various examples of generated dashboards, including:
- Cystic Fibrosis Research Dashboard
- Employee Training and Assessment Dashboard
- Sensor Data Analysis
- HR Statistics Dashboard
- Cache Hit Ratio Analysis
- Cache Performance Dashboard
- Sales Dashboard
- Period Analysis Dashboard
- Fire Inspection Dashboard
These examples demonstrate the versatility of Instachart in creating dashboards for diverse use cases.
By using Instachart, you can streamline the process of creating interactive dashboards and make data visualization more accessible and efficient. It's a valuable tool for anyone looking to bring their data to life quickly and effectively. Whether you are a data analyst, designer, or business professional, Instachart can help you transform your ideas into interactive realities.
AI Task and Project Management AI Document Summarization and Reading AI Smart Search AI Data Analysis Automated Workflow
Best Alternative Tools to "Instachart"
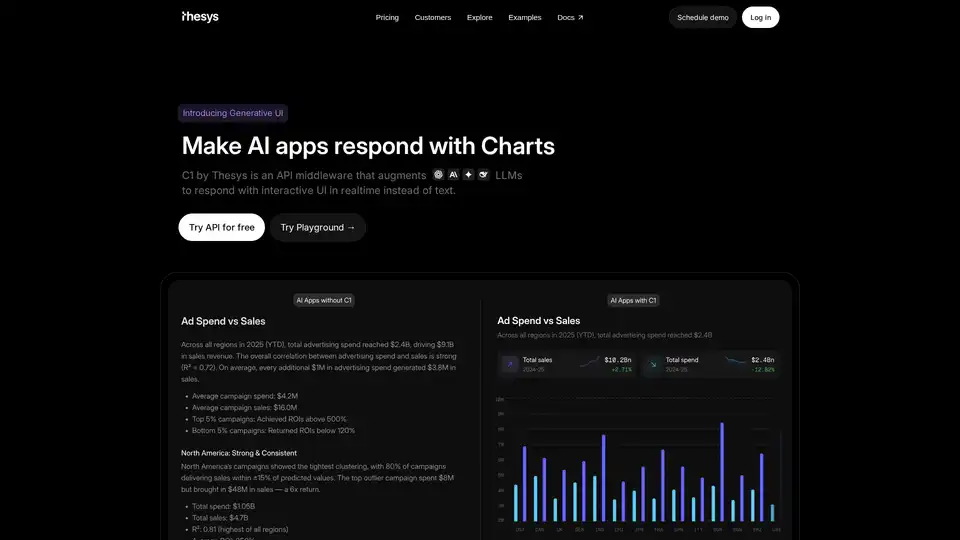
C1 by Thesys is an API middleware that augments LLMs to respond with interactive UI in realtime instead of text, turning responses from your model into live interfaces using React SDK.
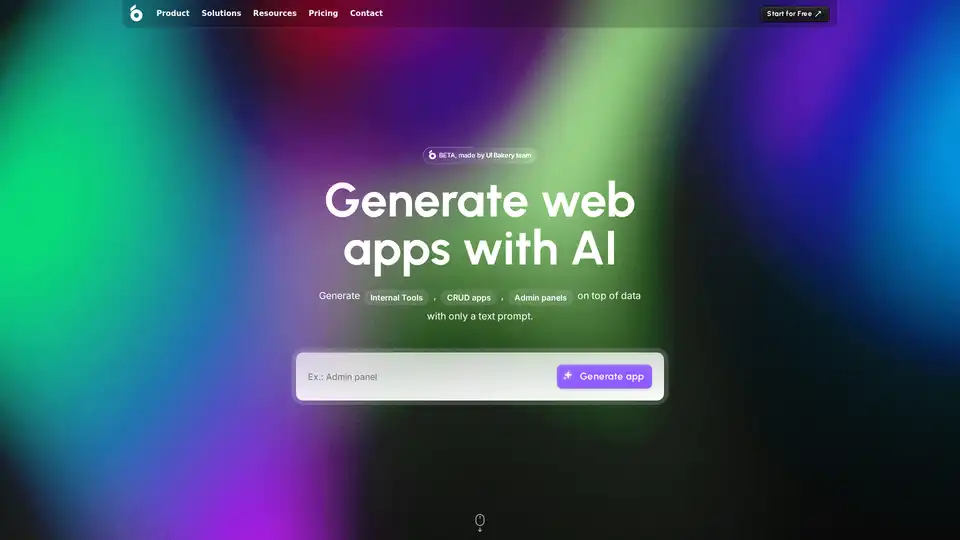
Generate apps from your data using just a prompt. Edit visually as needed. Share with your team.
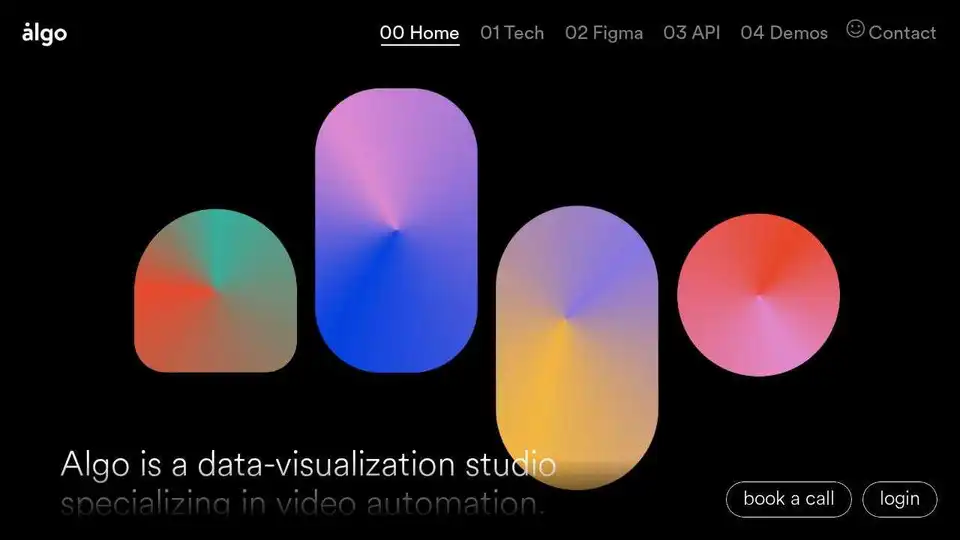
Algo is a data-visualization studio specializing in AI-driven video automation, turning data into videos at scale for marketing and editorial projects.
ExcelDashboardAI transforms Excel files into AI-powered data dashboards and reports in one click. Unlock data insights with AI-driven analysis and visualizations.