VibeChart
Overview of VibeChart
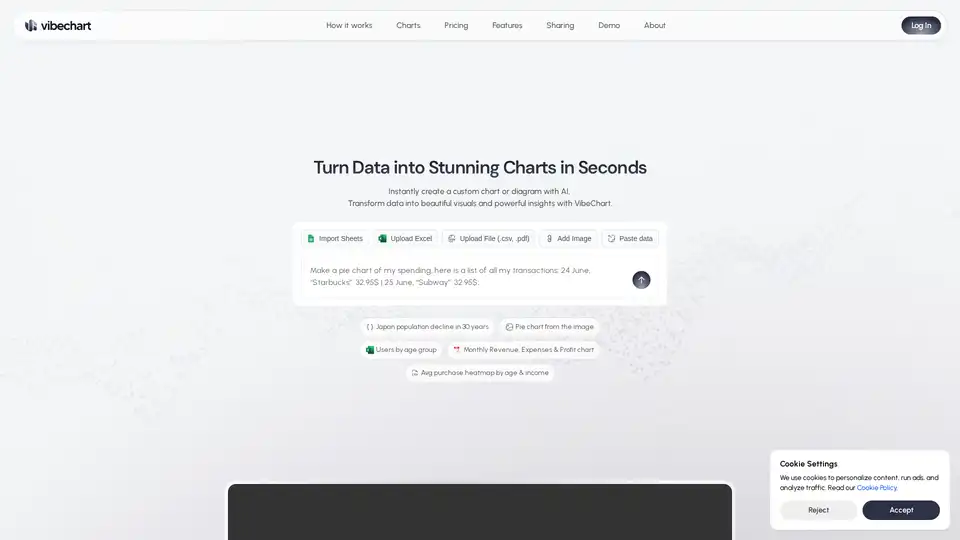
VibeChart: Transform Data into Stunning Charts with AI
What is VibeChart? VibeChart is an innovative AI-powered tool designed to transform your data into visually appealing and insightful charts in a matter of seconds. Trusted by over 500 business and research teams, VibeChart simplifies data visualization, making it accessible to everyone.
Key Features of VibeChart
- Text-to-Chart Interface: Create and customize over 40 types of charts using plain language and natural data queries. Simply describe the chart you need, and VibeChart will generate it.
- Built-in Data Engineer: Clean, transform, and extract insights from messy data with smart, instructable tools. VibeChart helps you prepare your data for visualization effortlessly.
- API & MCP Access: Access high-speed, reliable chart generation via API with 99.9% uptime and sub-2-second response time. Integrate VibeChart into your existing workflows seamlessly.
- Versatile Data Import: Import data from various sources, including Excel sheets, CSV files, PDFs, images, and plain text. VibeChart supports a wide range of data formats to accommodate your needs.
- Flexible Sharing Options: Export your charts as images, links, or embedded code and share them anywhere. VibeChart integrates with popular platforms like PowerPoint, Notion, Email, X (Twitter), API, Keynote, Slack, WhatsApp, LinkedIn, MCP, Google Slides, Airtable, Links, Substack, and web embeds.
How Does VibeChart Work?
VibeChart leverages AI to understand your data and generate relevant charts based on your input. Here’s how it works:
- Data Input: Upload your data using various methods, including Excel, CSV, PDF, images, or plain text.
- AI Processing: VibeChart's AI engine analyzes your data and identifies key patterns and relationships.
- Chart Generation: Based on your data and instructions, VibeChart creates a custom chart or diagram.
- Customization: Fine-tune your chart with the text-to-chart interface, adjusting labels, colors, and styles to match your preferences.
- Sharing: Export and share your chart as an image, link, or embedded code on various platforms.
Who is VibeChart For?
VibeChart is designed for a wide range of users, including:
- Data Analysts: Streamline your data visualization process and generate insights faster.
- Product Managers: Create compelling visuals to communicate product performance and trends.
- Consultants: Present data-driven recommendations with impactful charts and diagrams.
- Accountants: Visualize financial data and create clear, concise reports.
- Researchers: Transform research data into insightful visualizations for presentations and publications.
- Anyone who needs to visualize data quickly and easily.
Why Choose VibeChart?
- Speed: Create charts in seconds, saving you time and effort.
- Flexibility: Customize your charts with a user-friendly text-to-chart interface.
- Precision: Ensure accurate and reliable data visualization with AI-powered data processing.
- Shareability: Easily share your charts across various platforms and formats.
VibeChart Use Cases
VibeChart can be used across various domains, including:
- Data Analytics: Visualize key performance indicators (KPIs) and identify trends.
- Product Management: Track product metrics and communicate performance.
- Surveys: Present survey results in an easy-to-understand format.
- Consulting: Create impactful visuals to support your recommendations.
- Accounting: Visualize financial data and create reports.
- Investment: Analyze investment data and create charts for presentations.
- Quality Assurance: Track quality metrics and identify areas for improvement.
VibeChart Pricing
- The provided text doesn't include pricing information. Check the VibeChart website for detailed pricing plans.
Start Visualizing Smarter with VibeChart
Stop wasting time on manual charting and start transforming your data into stunning visuals with VibeChart. Try VibeChart today and experience the power of AI-driven data visualization.
Best Alternative Tools to "VibeChart"
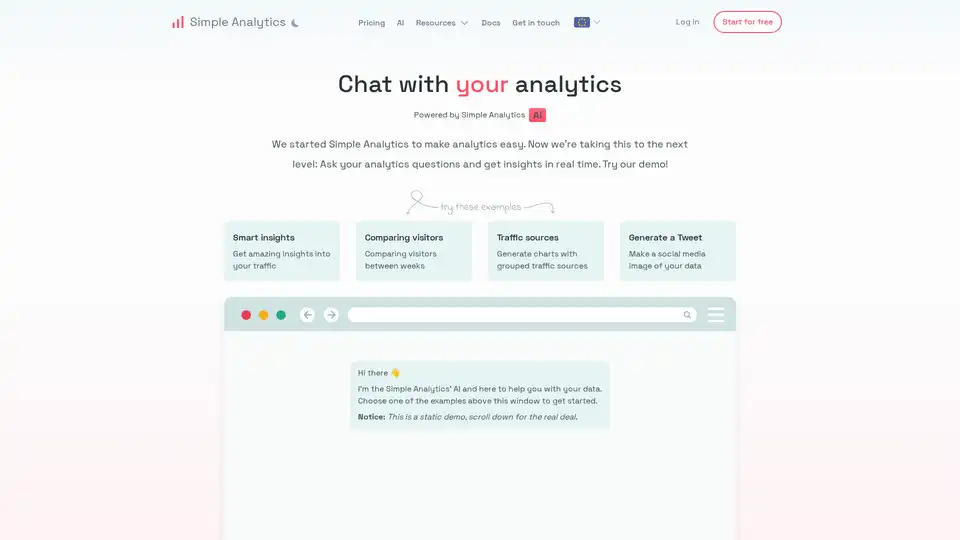
Chat with your analytics data and generate insights and beautiful charts.
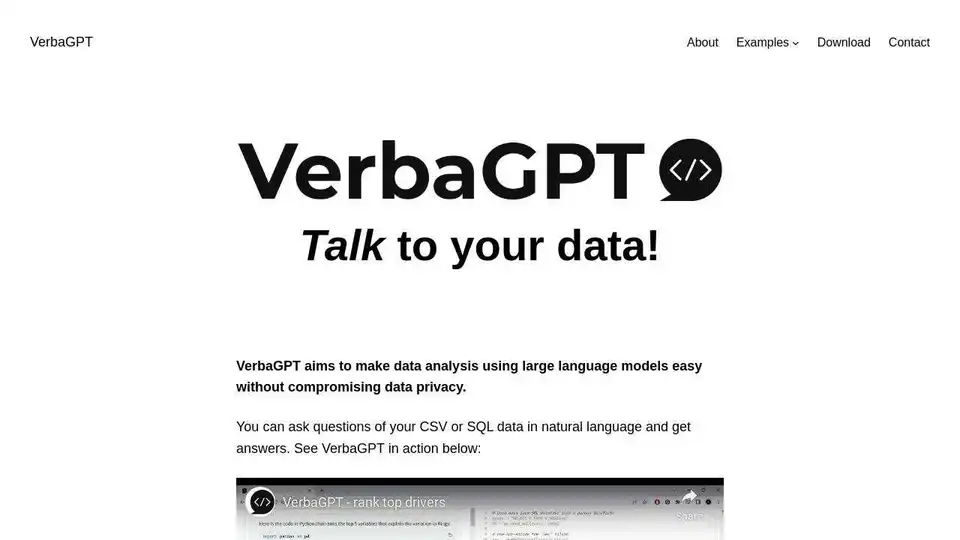
VerbaGPT empowers you to analyze data using natural language, leveraging LLMs while ensuring data privacy. Ask questions of SQL data, CSVs, or notes and get answers.
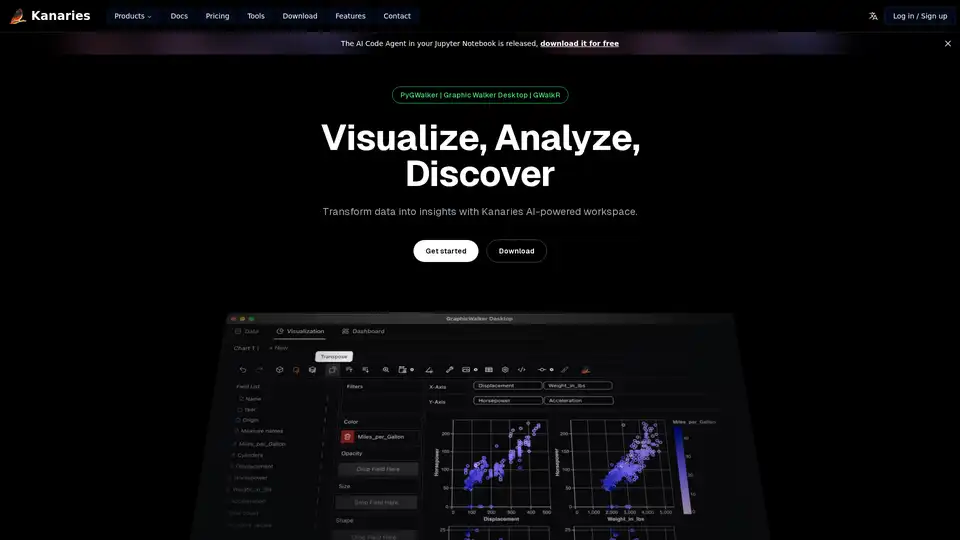
Make exploratory data analysis (EDA) easier with AI powered visual analytics. Discover, Analyze and Share data insights with ease.
Create interactive data apps with Python using Preswald. Build and deploy static sites for data analysis instantly. No JavaScript needed.
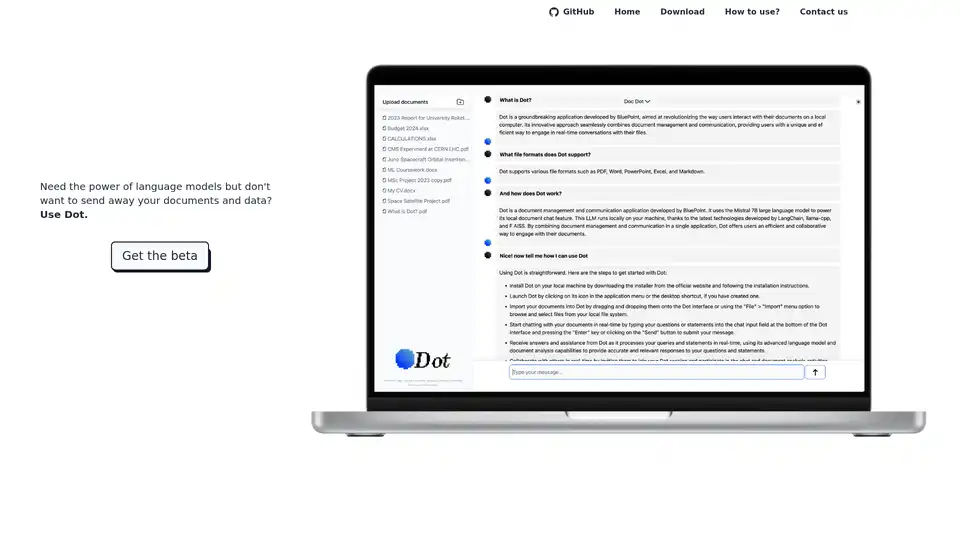
Dot is a local, offline AI chat tool powered by Mistral 7B, allowing you to chat with documents without sending away your data. Free and privacy-focused.
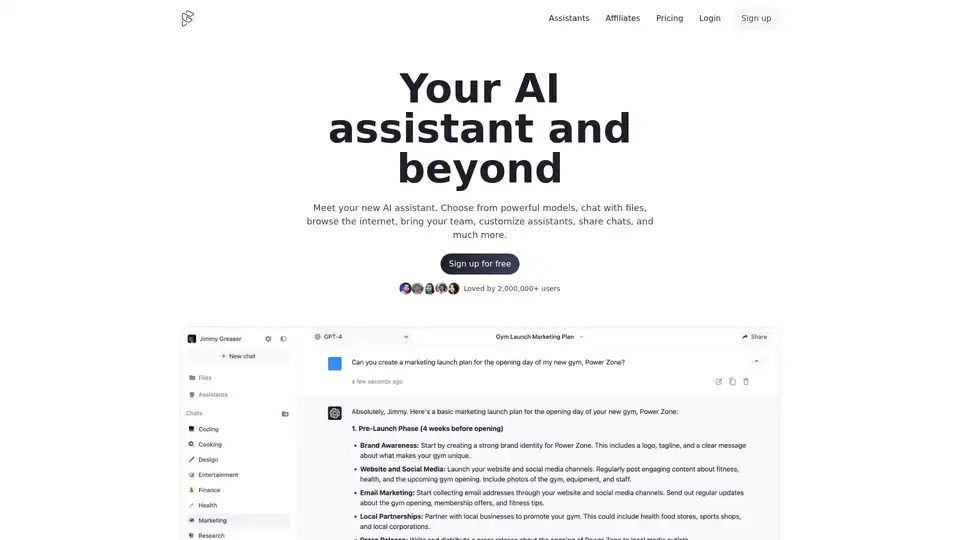
Forefront is an AI assistant that allows users to chat with files, browse the internet, and customize AI assistants. Choose from powerful models like GPT-4, GPT-3.5, Claude 2, and Claude Instant.
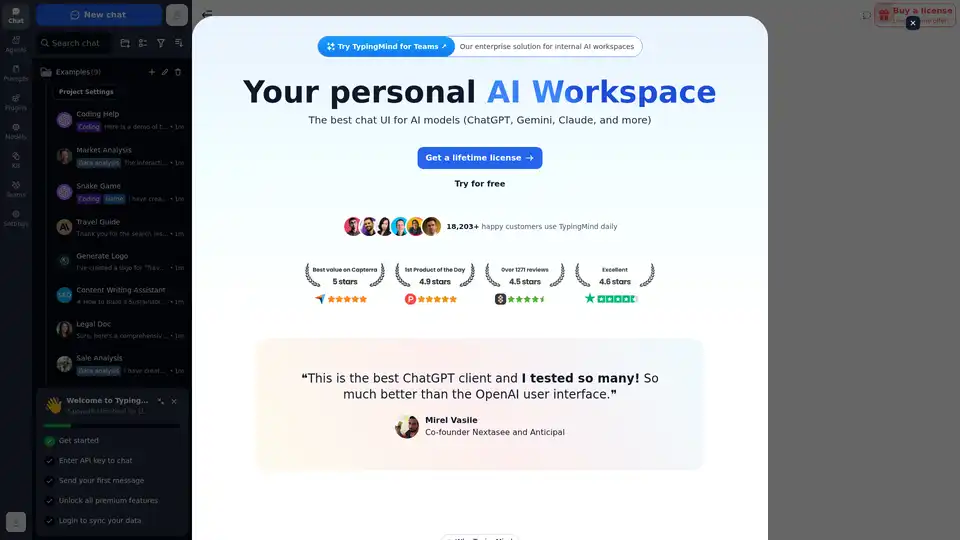
Chat with AI using your API keys. Pay only for what you use. GPT-4, Gemini, Claude, and other LLMs supported. The best chat LLM frontend UI for all AI models.
QueryX revolutionizes data search by translating natural language into SQL queries. Experience AI-driven insights for seamless data exploration. Ideal for business decision-makers.
Chat2DB is an AI-powered SQL client that transforms natural language into SQL queries. Supports MySQL, Redis, MongoDB, and enhances database management with Text2SQL and BI features.
Displayr is an AI-powered analysis and reporting solution transforming data into strategy in minutes. It integrates data, analysis, visualizations, and reports, automating workflows and enhancing insights.
Manus AI is the world's first general-purpose AI agent launching in 2025, turning thoughts into actions with SOTA GAIA benchmark performance. It automates complex tasks like travel planning, data analysis, and content creation for efficient productivity.
EzInsights AI is a business intelligence platform that analyzes your data with smart search. Get instant insights using natural language queries and make data-driven decisions.
GPTSidekick is an affordable AI assistant offering access to GPT-4, Claude 3, DALL-E 3, and more. Generate text, images, and speech with flexible, tiered plans.
Text to Infographic is an AI Infographic Generator that turns your text into visuals for your blog, social media, and more.