Pie Chart Maker
Overview of Pie Chart Maker
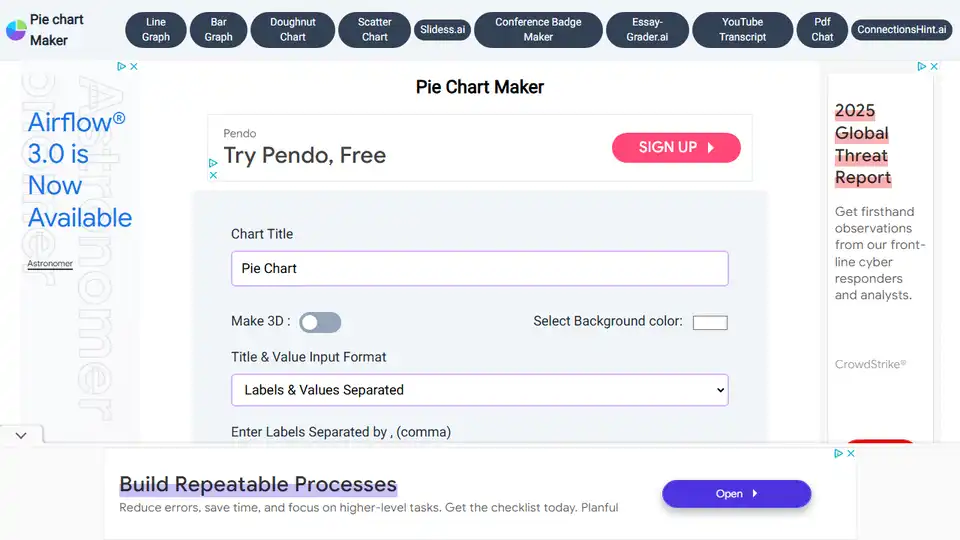
Pie Chart Maker: Create Stunning Visualizations with Ease
What is Pie Chart Maker?
Pie Chart Maker is a user-friendly online tool that allows you to create visually appealing pie charts in just a few clicks. Forget complex, traditional software – this tool simplifies the process, enabling you to easily input data and generate a ready-made pie chart.
Key Features of Pie Chart Maker
- Easy to Use: Intuitive interface for quick chart creation.
- Customizable:
- Change background color to match your design.
- Create 3D pie charts with a single click.
- Adjust the legend position as needed.
- Transform your pie chart into a doughnut chart easily.
- Customize title and legend colors.
- Downloadable: Save your pie chart in JPG, PNG, or SVG formats.
How does Pie Chart Maker work?
- Input Data: Enter your data labels and corresponding values.
- Customize: Adjust the chart's appearance using the various customization options.
- Generate: Click the 'Generate Graph' button to create your pie chart.
- Download: Download your chart in your preferred format (JPG, PNG, SVG).
Why is Pie Chart Maker important?
Pie charts are valuable for:
- Visualizing Data: Representing proportions and percentages in an easy-to-understand format.
- Simplifying Complexity: Turning complex data sets into simple visual representations.
- Effective Communication: Conveying information quickly and clearly to an audience.
Where can I use Pie Chart Maker?
Pie Chart Maker is perfect for:
- Business Presentations: Showcasing market share, budget allocations, or sales data.
- Educational Purposes: Teaching students about data representation.
- Personal Projects: Visualizing personal finances, survey results, or other data sets.
What is a Pie Chart?
A pie chart is a circular statistical graphic divided into slices to illustrate numerical proportion. Each slice represents a proportion of the whole, with the entire pie representing 100%. Pie charts are best suited for displaying small data sets, providing a clear visual representation of the relative sizes of different categories.
A doughnut chart is a variation of the pie chart, featuring a hole in the center, which can be used to display additional information or simply for aesthetic purposes.
Similar Tools
- Line Graph Maker
- Bar Graph Maker
- Doughnut Chart Maker
- Scatter Chart Maker
With Pie Chart Maker, transforming raw data into visually compelling and informative pie charts has never been easier. Start creating your charts today and unlock the power of data visualization!
Best Alternative Tools to "Pie Chart Maker"
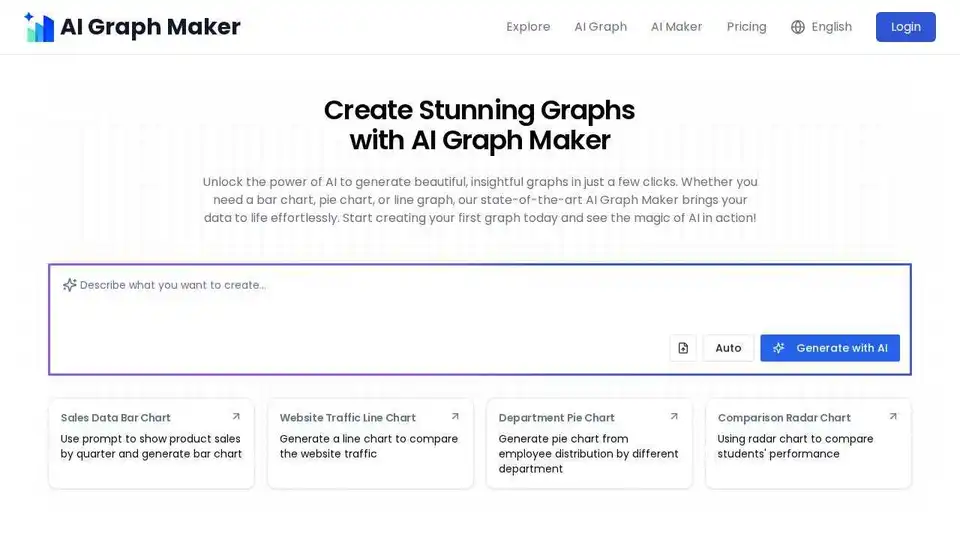
Create interactive charts with AI Graph Maker. Turn your data to custom bar charts, line charts, flowcharts, pie charts and scatter plots with AI effortlessly.
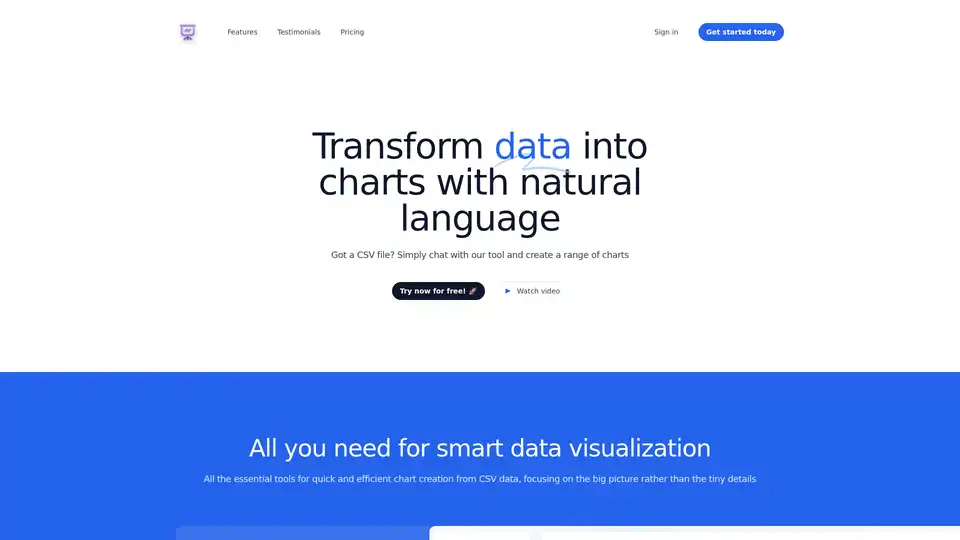
Chat2CSV transforms CSV data into charts using natural language. Simply chat with the tool to create various charts. Secure, privacy-focused, and AI-supported.
Simplify Data Analysis with CSV Files: Anyone Can Analyze Data with Ease.
INSIGHT DOCUMENT is an AI-powered platform for document analysis and report generation. Extract knowledge, analyze content, and gain meaningful insights from your documents with advanced AI.
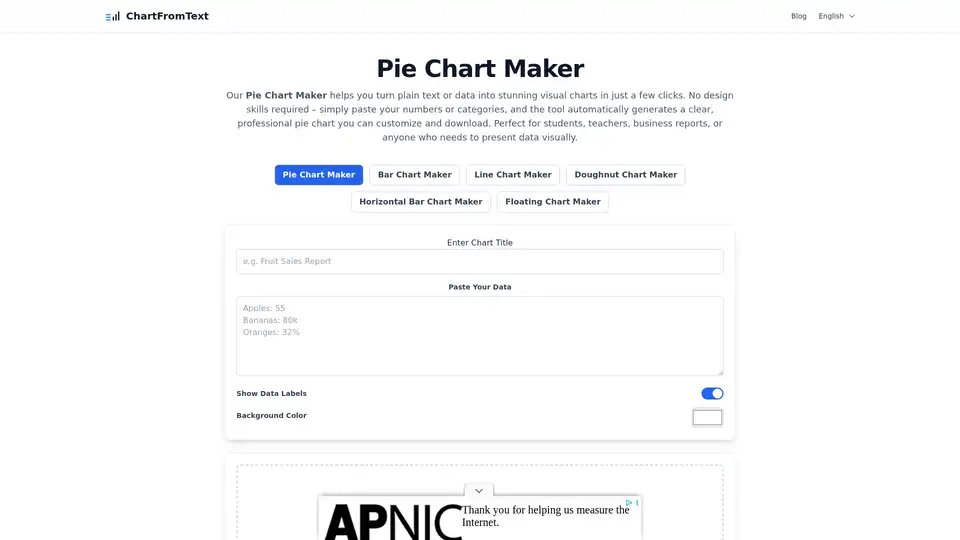
Create the best Pie Chart online for free with our Pie Chart Maker. Quick, customizable, and perfect for reports, projects, and presentations.

Athena AI is an AI-powered data analytics and BI platform that transforms raw data into actionable insights. Get real-time business insights with advanced data visualization and predictive analytics.
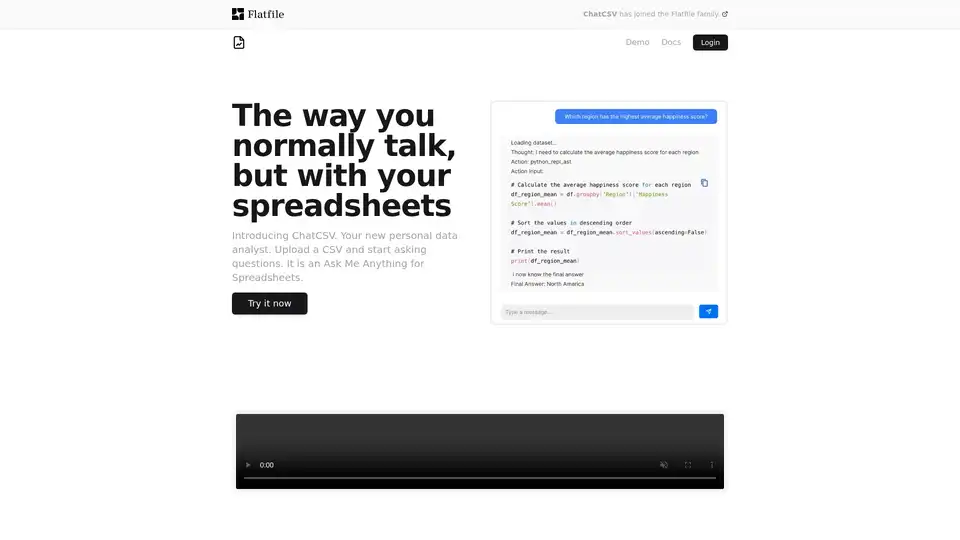
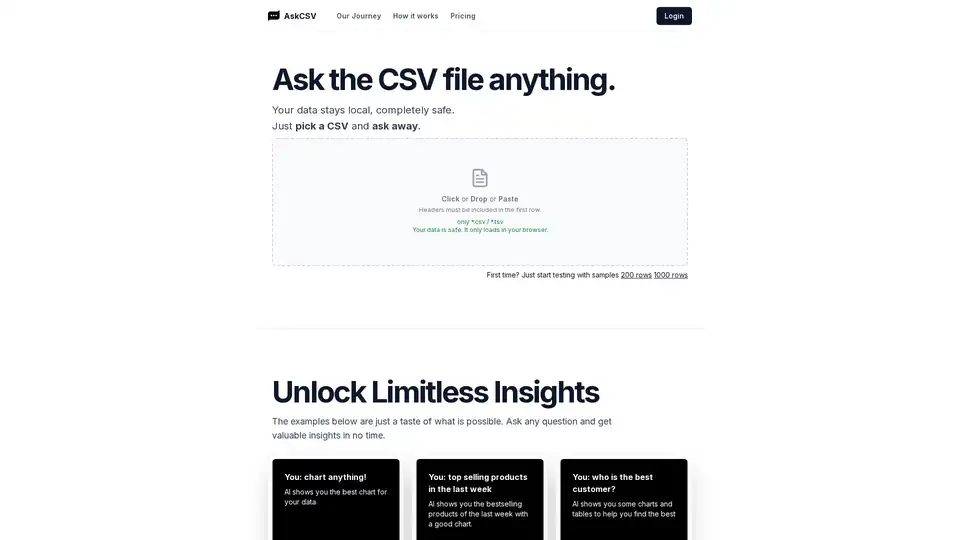
ChatCSV is an AI-powered personal data analyst that allows you to ask your CSV documents anything. Visualize data, analyze trends, and gain insights from your spreadsheets effortlessly.
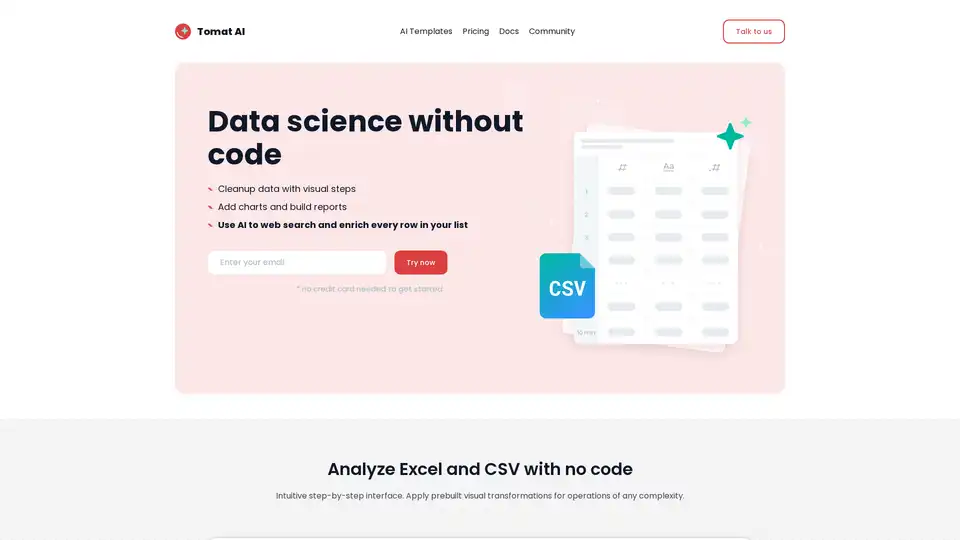
Load CSV and analyze it in a visual step-by-step interface. Cleanup, extract, summarize, or make sentiment analysis with your personal AI agent.
Generate AI diagrams 10X faster with this AI Flowchart Diagram Tool. Convert text, PDFs, blogs, and images to flowcharts effortlessly. Create unique diagrams with explanation powered by ChatGPT.
SimplyBudget AI is a smart budgeting app that uses AI to simplify financial management. Track expenses, set goals, and manage loyalty cards effortlessly. Download today to achieve financial freedom!
Insight7 automatically analyzes collections of interviews in video, audio, or text for accurate insights that power high-quality decisions.
Create stunning infographics, reports, and presentations in seconds with Piktochart AI. Transform complex ideas into captivating visuals. Start for free!

SlidesWizard uses AI to create professional PowerPoint and Google Slides presentations in seconds. Generate outlines, add images, and speaker notes automatically.
HelloCaLinda is an AI-powered voice assistant that manages your Google Calendar. Schedule meetings, set reminders, and track progress effortlessly. Subscription required.