Create Effective Visuals with AI | MyLens
Overview of Create Effective Visuals with AI | MyLens
Transform your ideas and content into engaging visuals with MyLens AI. Whether you're simplifying complex information, creating educational materials, or enhancing business presentations, MyLens helps you communicate more effectively. Its AI-powered features allow you to generate mind maps, timelines, tables, and more, making it an invaluable tool for students, educators, and professionals alike. Experience the power of visual storytelling with MyLens today!
Best Alternative Tools to "Create Effective Visuals with AI | MyLens"
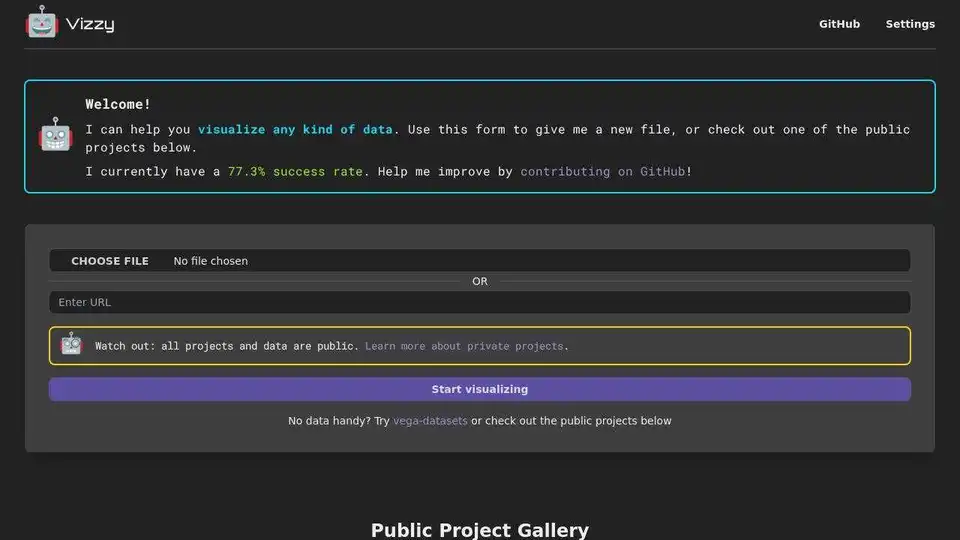
Vizzy is a data visualization tool powered by LLMs. Connect to OpenAI to rapidly visualize your data. Explore public projects and datasets or contribute on GitHub.

Visualize your dream home instantly with Quick Dreamviz. Upload a photo, select styles, and let AI transform your space. Get AI-powered room redesign previews in seconds.
WEAPONIZED RESUME uses AI to tailor your resume and cover letter to specific job descriptions, saving you time and increasing your chances of getting noticed. Simplify your job application process today!
Boost sales with Wizart's next-gen visualization tools for home improvement retail & manufacturing. AI-powered visualizer, MaterialCloud & Vision API.
StoryLegend is an AI-powered writing platform for authors & novelists. Features include outlining, character development, plot generation & AI assistance to help you write faster and create better stories.
ChartFast is an AI data analyst tool designed to streamline data visualization and analysis tasks. Generate precise graphs in seconds and automate repetitive data work.
NoteGPT is an AI learning assistant that summarizes YouTube videos, PDFs, and more. Create notes, mind maps, and presentations to boost learning efficiency by 10x.
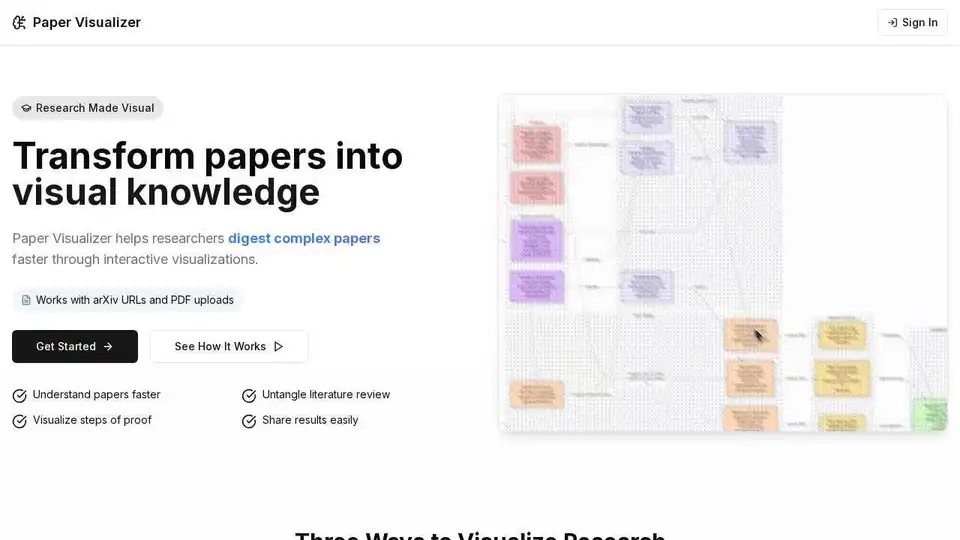
Paper Visualizer is an AI-powered tool that transforms research papers into interactive diagrams, literature review maps, and step-by-step proof visualizations, reducing comprehension time by 60-80%.
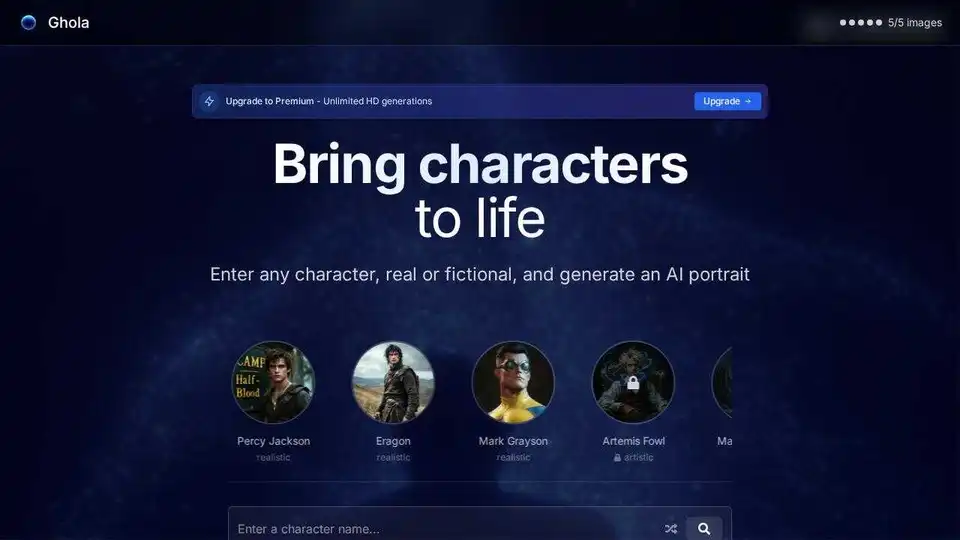
Ghola is an AI-powered character visualization tool that allows you to bring any character, real or fictional, to life with stunning AI portraits. Generate fantasy characters, sci-fi heroes, and more.
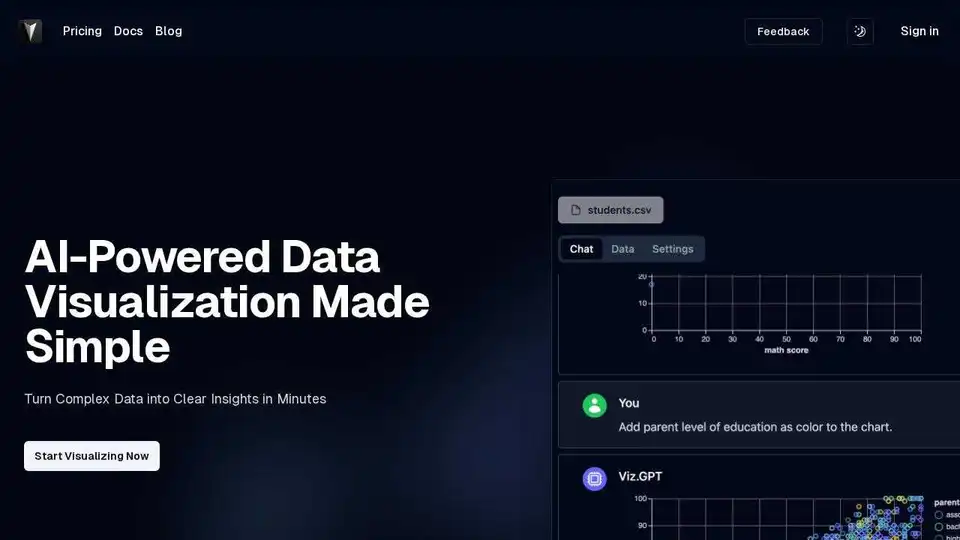
Explore your tabular data with AI, the AI for Data Science, the AI can understand complex patterns in visualizations.
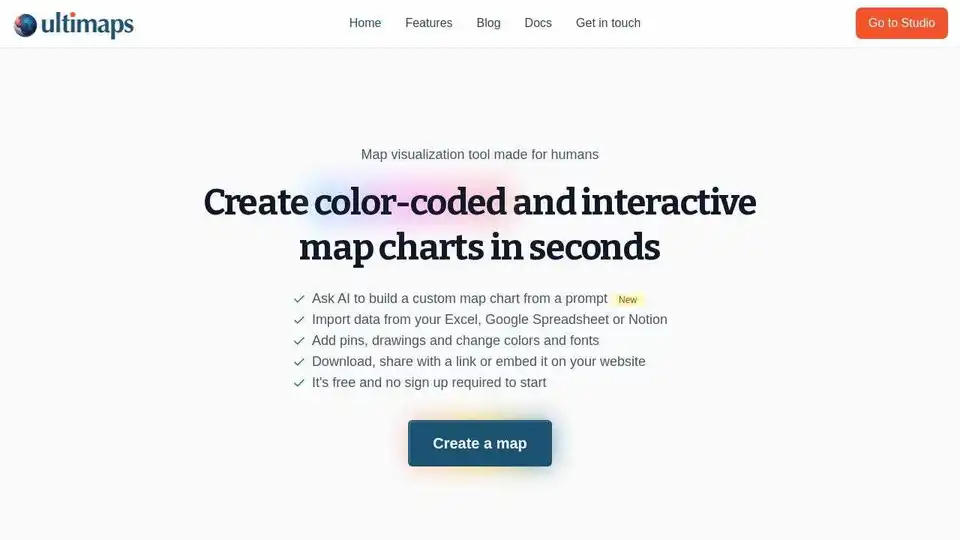
Ultimaps: Create custom static and interactive maps from data or prompts in seconds. No sign-up required. Download, share or embed anywhere.