Kanaries
Overview of Kanaries
What is Kanaries?
Kanaries is an innovative AI-powered platform designed to simplify exploratory data analysis (EDA), transforming complex datasets into actionable insights through intuitive visual analytics. At its core, Kanaries integrates advanced AI capabilities into a collaborative workspace, enabling users to visualize, analyze, and share data effortlessly. Whether you're working with Python notebooks, R environments, or web-based applications, Kanaries streamlines the data exploration process, making it accessible for data scientists, analysts, and business professionals alike.
Founded on the principle of democratizing data analysis, Kanaries leverages artificial intelligence to automate tedious tasks, suggest next steps, and uncover hidden patterns in data. It's not just a tool; it's a comprehensive ecosystem that includes specialized products like AI code agents, interactive visualization apps, and desktop editors, all built to enhance productivity in data-driven workflows.
Core Features of Kanaries
Kanaries stands out with its suite of powerful tools tailored for modern data workflows. Here's a breakdown of its key offerings:
Runcell.dev (AI Code Agent for Jupyter Notebooks): This fully automatic AI assistant integrates seamlessly into your Jupyter environment. It understands your code and data context, providing inline code completion and intelligent suggestions for the next analytical steps. Ideal for Python users, it accelerates coding by predicting and generating relevant code snippets based on your ongoing analysis.
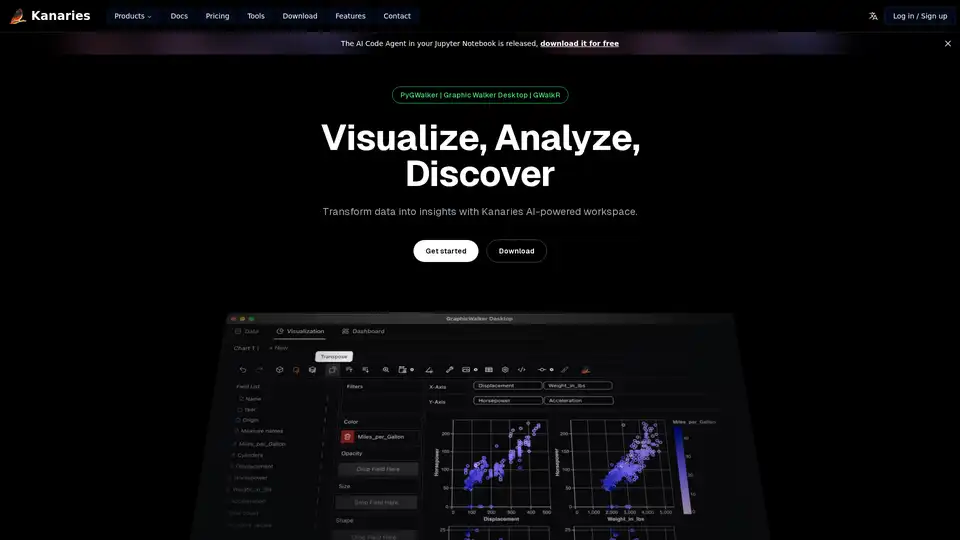
PyGWalker: A lightweight, one-line code integration tool that converts pandas DataFrames into interactive visual analytics apps directly in Jupyter notebooks. With drag-and-drop functionality, users can explore data through interactive charts, histograms, and scatter plots, exporting visualizations for reports or sharing with teams.
Graphic Walker Desktop: A native desktop application for macOS and Windows, offering high-performance data processing for offline EDA. It provides a focused interface for building complex visualizations without internet dependency, perfect for sensitive or large-scale datasets.
Graphic Walker Component: An embeddable component for web developers using frameworks like React, Vue, or Angular. It features a drag-and-drop interface enhanced by AI-powered chat (VizChat), allowing end-users to query data in natural language for instant insights.
GWalkR: Tailored for R users in RStudio, this tool turns R data frames into interactive exploration environments with minimal code. It supports interactive charts in R Markdown and leverages high-performance computation for seamless analysis.
These features are interconnected within the Kanaries workspace, supporting on-the-fly data exploration, collaborative sharing, and AI-driven querying via VizChat. For instance, you can drag and drop elements to visualize flight data or chat with the AI to ask, "What trends do I see in this dataset?" and receive tailored visualizations.
How Does Kanaries Work?
Kanaries operates on a user-friendly, AI-enhanced architecture that combines visual interfaces with machine learning algorithms. The workflow typically starts with data import—supporting formats like CSV, JSON, Excel, and SQLite. Once loaded, the platform's AI engine analyzes the data structure, suggesting optimal visualization types and highlighting potential insights.
For example, in PyGWalker or Graphic Walker, the drag-and-drop canvas allows you to select dimensions and measures intuitively, while the AI backend processes computations in real-time. VizChat adds a conversational layer, using natural language processing (NLP) to interpret queries and generate charts or summaries without manual coding.
Under the hood, Kanaries employs techniques like automated feature engineering and pattern recognition, drawing from large language models to provide context-aware assistance. This is particularly evident in Runcell.dev, where the AI code agent scans your notebook cells to offer completions that align with data science best practices, reducing errors and time spent on boilerplate code.
Collaboration is baked in: users can share interactive charts and datasets with teams, enabling real-time feedback and decision-making. The platform scales from individual explorations to enterprise-level BI tools, ensuring data security and performance even with large volumes.
How to Use Kanaries?
Getting started with Kanaries is straightforward and requires no steep learning curve. Here's a step-by-step guide:
Sign Up and Access the Workspace: Visit the Kanaries website, create a free account, and log in to the dashboard. Download desktop apps or integrate via code for notebooks.
Import Your Data: Upload files directly or connect to sources. Tools like CSV to Chart Online or Excel to Chart Online provide quick conversions.
Explore with AI Assistance: Use drag-and-drop for basic visualizations or VizChat for natural language queries. In Jupyter, install PyGWalker with a single pip command:
pip install pygwalker, thenwg = pygwalker.PyGWalker(df)to launch an interactive app.Analyze and Iterate: Leverage AI suggestions for deeper insights—ask the code agent for optimizations or use GWalkR in RStudio for statistical explorations.
Share and Collaborate: Export charts as images, embeds, or interactive links, or invite team members to the shared workspace.
For developers, the Graphic Walker Component integrates via npm packages, allowing custom BI dashboards. Free trials and documentation are available on the site, with GitHub repos for open-source components like PyGWalker and GWalkR.
Why Choose Kanaries?
In a crowded market of data tools, Kanaries differentiates itself through its AI-first approach and versatility across environments. Traditional EDA often involves manual scripting and trial-and-error visualization, which can be time-consuming and error-prone. Kanaries automates these pain points, boosting efficiency by up to 5x according to user feedback in community resources.
Its practical value shines in real-world applications: data scientists save hours on code writing, business analysts gain quick insights without coding expertise, and teams collaborate more effectively. The platform's offline capabilities and cross-platform support (Python, R, web, desktop) make it adaptable to diverse workflows, from academic research to enterprise reporting.
Moreover, Kanaries emphasizes scalability—handling high-performance computations without lag—and community-driven features, like AI-generated data apps in the lab resources section. It's cost-effective, with free downloads for core tools and tiered pricing for advanced collaboration.
Who is Kanaries For?
Kanaries caters to a broad audience in the data ecosystem:
Data Scientists and Developers: Those using Jupyter or RStudio who need AI-assisted coding and rapid prototyping.
Business Intelligence Professionals: Teams building dashboards and sharing insights, especially in BI tool development.
Analysts and Researchers: Anyone performing EDA on flight data, sales metrics, or scientific datasets requiring visual exploration.
Educators and Students: For teaching data visualization with interactive, low-code tools.
If you're frustrated with rigid analytics software or seeking an AI boost for your data projects, Kanaries is an ideal fit. It's particularly valuable for small to medium teams looking to unlock data's potential without heavy IT investments.
Best Ways to Maximize Kanaries
To get the most out of Kanaries, start with small datasets to familiarize yourself with VizChat and the code agents, then scale to collaborative projects. Explore community resources on GitHub for extensions, like AI for VegaLite visualizations or converting photos to text notes. Regularly update tools via the downloads section for new AI enhancements.
In summary, Kanaries revolutionizes exploratory data analysis by blending AI intelligence with user-centric design. Whether you're discovering trends, optimizing code, or building BI solutions, it empowers you to turn raw data into strategic advantages. Try it today via the free trial and experience how AI can transform your analytical process.
Best Alternative Tools to "Kanaries"
Datasette is an open-source tool for exploring and publishing data. It helps analyze data, create interactive websites & APIs, and is ideal for data journalists, researchers, and anyone sharing data.
Strella is an AI-powered platform transforming customer research. It conducts in-depth interviews and delivers actionable insights in hours, using AI to moderate interviews and synthesize data in real-time.

Aicado AI is a no-code platform that allows businesses to launch branded AI agents in minutes. It supports chat, voice, and visual AI agents with customization options and integrations.
Devzery revolutionizes API testing with AI-driven automation for regression, integration, and load tests. Integrate into CI/CD pipelines for faster, bug-free releases and enhanced efficiency in software development.
CEBRA is a self-supervised AI algorithm that jointly analyzes behavioral and neural data to create consistent, interpretable latent embeddings for neuroscience research, enabling accurate decoding of positions, videos, and movements across species.
Transform complex data analysis with Fabi.ai's all-in-one AI platform. Combine SQL, Python, and AI automation for faster insights, dashboards, and workflows from your data sources like Google Sheets and warehouses.
TickerTrends is an AI-powered platform that transforms consumer interest data into actionable KPI predictions, helping investors forecast company performance with precision using alternative data sources.
Hex is the AI-powered analytics workspace designed for teams to drive faster answers, better decisions, and collaborative data exploration with notebooks, apps, and self-serve tools.
Arize AI provides a unified LLM observability and agent evaluation platform for AI applications, from development to production. Optimize prompts, trace agents, and monitor AI performance in real time.
AI Answer Generator helps you generate instant AI answers for any question. Get quick and accurate responses with this free online AI question answering tool.
PredictEasy is a no-code AI-powered data analytics platform for effortless data exploration, visualization, and machine learning. Discover actionable insights and grow your business.
Aleph Alpha's PhariaAI empowers enterprises with sovereign AI solutions. Secure data, shape AI-driven knowledge work. Explore PhariaAI for transparent, compliant, and future-proof AI.
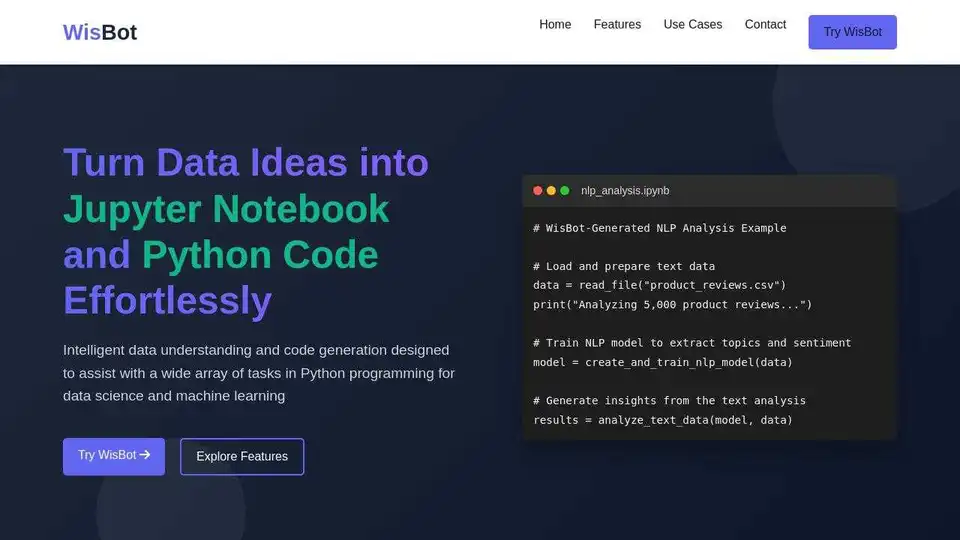
WisBot is an AI co-inventor for data discovery. Upload data, get executed Jupyter notebooks, trained ML models, and production-ready code in minutes. Skip the setup, get straight to insights.
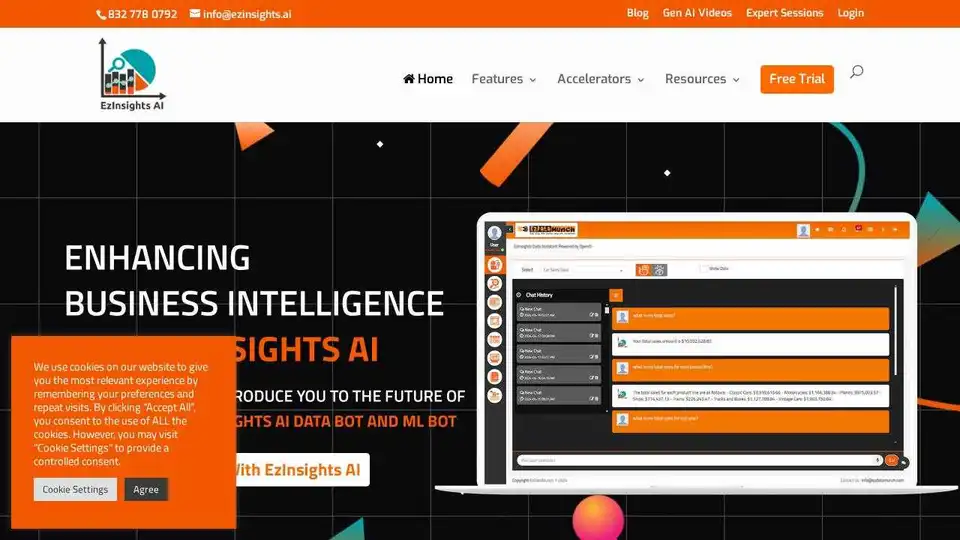
EzInsights AI is a business intelligence platform that analyzes your data with smart search. Get instant insights using natural language queries and make data-driven decisions.