Painboard
Overview of Painboard
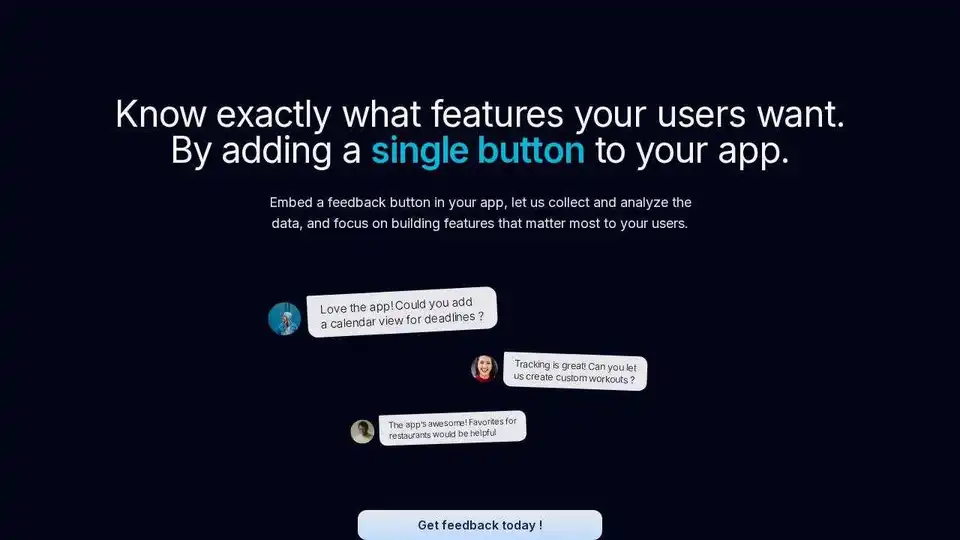
What is Painboard?
Painboard is an innovative AI-powered platform designed to transform unstructured customer feedback into actionable insights. In today's fast-paced business environment, companies often struggle with scattered customer data from various channels like surveys, reviews, support tickets, and call transcripts. Painboard centralizes this qualitative information, using advanced AI to analyze it at scale, uncover hidden themes, and quantify sentiments. This allows product managers, customer success teams, and executives to make informed, data-driven decisions without the hassle of manual tagging or sifting through endless data piles.
Developed by jimu Labs, Painboard stands out by blending AI precision with human customization, ensuring insights are not just generated but tailored to your team's unique workflow. Whether you're dealing with hundreds or thousands of feedback entries monthly, this tool eliminates guesswork and anecdotal evidence, providing a clear path from raw data to strategic actions.
How Does Painboard Work?
At its core, Painboard leverages artificial intelligence to process large volumes of unstructured qualitative data efficiently. Here's a breakdown of its working principle:
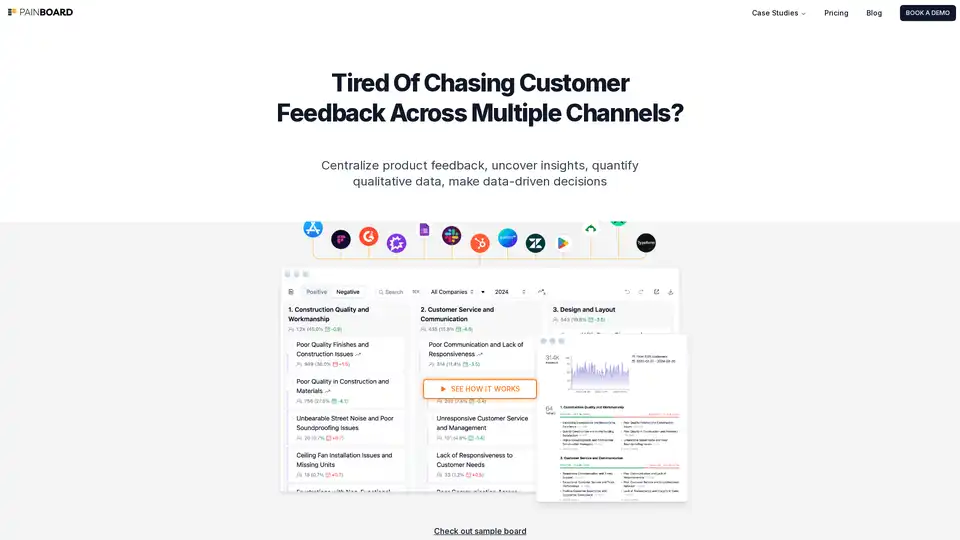
Data Centralization and Ingestion: Import feedback from multiple sources, including NPS surveys, product reviews, support tickets, and call transcripts. Painboard integrates seamlessly with various tools, merging insights into a single dashboard for a comprehensive view.
AI-Driven Analysis: The AI automatically analyzes the data, building a dynamic taxonomy of themes. It identifies patterns, sentiments, and emerging trends that might be overlooked in manual reviews. For instance, it surfaces deep insights like recurring pain points or feature requests, complete with context from original customer quotes.
Quantification and Visualization: Turn qualitative data into quantifiable metrics. Filter and segment themes by dimensions such as channels, locations, time periods, or customer segments. Visualize frequency of issues, revenue impact, and performance comparisons through interactive charts and reports.
Customization and Learning: Unlike rigid analytics tools, Painboard adapts to your needs. Users can merge, split, rename, or nest themes, creating a hierarchy that fits your organization's structure. Once customized, the AI learns from these changes and automatically routes new incoming data to the appropriate categories. It even highlights new themes based on emerging patterns, keeping your insights fresh and relevant.
Sharing and Collaboration: Generate shareable links for any view—be it a theme report, highlights summary, or segment comparison. Colleagues access the exact same perspective without needing their own accounts, fostering team-wide collaboration.
This adaptive workflow ensures that the more you use Painboard, the more intuitive and efficient it becomes, saving time and reducing errors in feedback analysis.
Key Features of Painboard
Painboard offers a suite of features that make it indispensable for handling customer feedback:
Multi-Level Insights Viewing:
- 10,000-Foot View: High-level highlights, trends, and overall sentiments for quick overviews.
- 1,000-Foot View: Detailed theme hierarchy and popular topics to dive into specifics.
- Ground-Level View: Original customer quotes in context for granular understanding.
Scalable Processing: Handles massive data volumes—real-time stats show thousands of feedback entries analyzed and customers listened to, proving its robustness for enterprise use.
Smart Dashboard Customization: Edit themes once, and the AI remembers. Add columns, create hierarchies, or delete redundancies effortlessly.
Integration Capabilities: Works with your existing tech stack, centralizing data from diverse channels without disrupting workflows.
Security and Privacy Focus: Automatically removes personally identifiable information (PII), uses encryption, conducts audits, and ensures data isn't shared with third parties. Compliance with privacy policies is a priority.
These features address common pain points in customer feedback management, such as manual tagging, overlooked insights, and siloed data.
How to Use Painboard?
Getting started with Painboard is straightforward, especially for teams already overwhelmed by feedback volume:
Sign Up and Integrate: Request a demo via the website to explore integrations. Connect your data sources like survey tools or CRM systems.
Upload and Analyze: Feed in your unstructured data. The AI kicks off analysis, generating initial themes and insights within minutes.
Customize Your Board: Refine the taxonomy by editing themes to match your business context. Use the intuitive interface to merge or split categories.
Explore and Visualize: Navigate the dashboard views to filter data, run comparisons, and quantify impacts. Export or share reports as needed.
Iterate and Scale: As new data flows in, Painboard auto-categorizes it based on your preferences. Regularly review emerging themes to stay ahead of customer needs.
No coding or technical expertise required—it's designed for non-technical users like product directors and support teams. Book a demo to see it in action with your sample data.
Why Choose Painboard?
In a market flooded with generic analytics tools, Painboard differentiates itself through its focus on qualitative depth and user-centric adaptability. Traditional methods often lead to ignored insights due to lack of personalization, as noted by Justin Ruckman, Director of Product & Design at EverCommerce: "Painboard was the only tool that surfaced the depth in themes and provided the ability to personalize the results, which makes the difference between insights being actionable vs. ignored."
Key benefits include:
- Efficiency Gains: Stop chasing feedback across channels; centralize everything in one place.
- Actionable Outcomes: Quantify qualitative data to measure issue frequency, revenue impact, and trends over time.
- Team Empowerment: Custom workflows mean insights align with your priorities, reducing miscommunication.
- Scalability: Proven with real production stats, it's built for growing businesses handling high-volume feedback.
Compared to competitors, Painboard's AI-human hybrid approach ensures insights aren't just surfaced but made immediately usable, leading to faster product improvements and better customer retention.
Who is Painboard For?
Painboard is ideal for:
- Product and Design Teams: Uncover user pain points and feature requests from feedback to inform roadmaps.
- Customer Success and Support Managers: Track sentiments and resolve issues proactively by segmenting data.
- Executives and Analysts: Gain high-level business intelligence to drive strategic decisions with quantifiable evidence.
- Any Business with Qualitative Feedback: Especially SaaS companies, e-commerce platforms, or service providers dealing with NPS, reviews, or tickets.
If your team spends hours on manual analysis or struggles with feedback overload, Painboard is a game-changer. It's particularly valuable for mid-to-large enterprises where data volume outpaces manual capabilities.
Practical Value and Use Cases
The real-world value of Painboard shines in its ability to turn feedback into tangible business outcomes. For example:
- Product Iteration: A company analyzing support tickets might discover a recurring UI issue affecting 20% of users, quantified by revenue loss, prompting a targeted fix.
- Customer Segmentation: Compare sentiments across regions to tailor marketing or support strategies.
- Trend Monitoring: Automatically detect emerging themes, like shifting preferences post-product update, to stay agile.
User testimonials highlight its impact: Teams report reduced analysis time by 80% and more personalized insights leading to higher customer satisfaction. With features like easy sharing, it also boosts cross-functional collaboration, ensuring feedback influences decisions at all levels.
Frequently Asked Questions About Painboard
What types of customer feedback can Painboard analyze? Painboard excels at diverse qualitative data, including NPS surveys, product reviews, support tickets, and call transcripts. It's optimized for large volumes of unstructured entries, using AI to reveal hidden trends.
Can Painboard integrate with other tools? Yes, it centralizes feedback from multiple channels and integrates with your existing systems for a unified view.
How does Painboard handle large data volumes? Engineered for scalability, it processes thousands of entries efficiently, with real-time stats demonstrating its production-ready performance.
What about data security? Security is paramount: PII is auto-removed, data is encrypted, audits are regular, and access is controlled. No third-party sharing—check the privacy policy for details.
Is sharing insights easy? Absolutely, just copy a URL for any report or view, and your team sees the same customized perspective.
Best Way to Get Started with Customer Feedback Analysis? Begin by booking a demo on the Painboard website. Upload sample data to experience how AI transforms your feedback into insights that drive growth. With its adaptive learning, Painboard not only analyzes today’s data but evolves with your business needs.
In summary, Painboard bridges the gap between raw customer voices and strategic actions, empowering businesses to listen deeply and act decisively. If unstructured feedback is hindering your progress, this tool delivers the clarity and customization needed for success.
Best Alternative Tools to "Painboard"
Backsy.ai is an AI-powered platform that analyzes customer feedback from various sources, providing actionable insights, attribute scores, and emerging themes in minutes, eliminating manual analysis.

AIQDA (formerly Meetpulp) automates qualitative analysis with AI-driven transcription, smart summaries, collaborative coding, and code discovery. It supports 100+ languages and offers free & paid plans for researchers.
AILYZE is an AI-powered qualitative data analysis software that provides thematic analysis, content analysis, and an AI chatbot for quick data insights from documents and spreadsheets.
riyo.ai is an AI-powered unified behavior analytics platform that captures events, session replays, heatmaps, and error tracking to optimize user experience and increase conversion rates.
Appinion provides AI-powered app review analysis, helping you collect feedback, analyze trends, and make data-driven decisions to boost your app's performance. Unlock your app's potential with smarter insights.
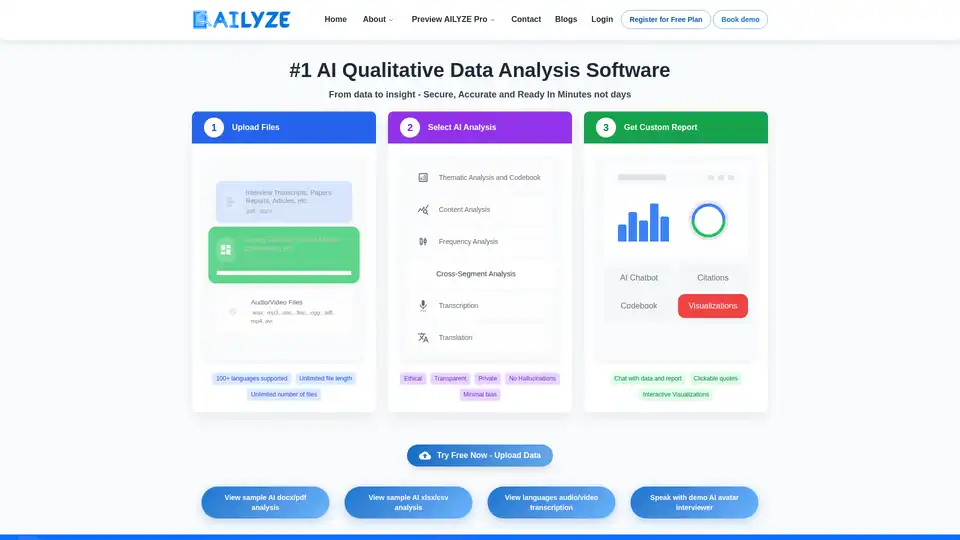
AILYZE is the leading AI qualitative data analysis software that transforms documents, spreadsheets, audio, and video into actionable insights in minutes. Secure, multilingual support for thematic analysis, transcription, and visualizations.
Notably is an AI-powered research platform that helps teams analyze qualitative data and generate insights faster. It features AI clustering, automated tagging, video transcription, and customizable research templates.
Get a preview of Sprig’s upcoming AI Analysis features that will transform how teams understand and optimize their product experience.
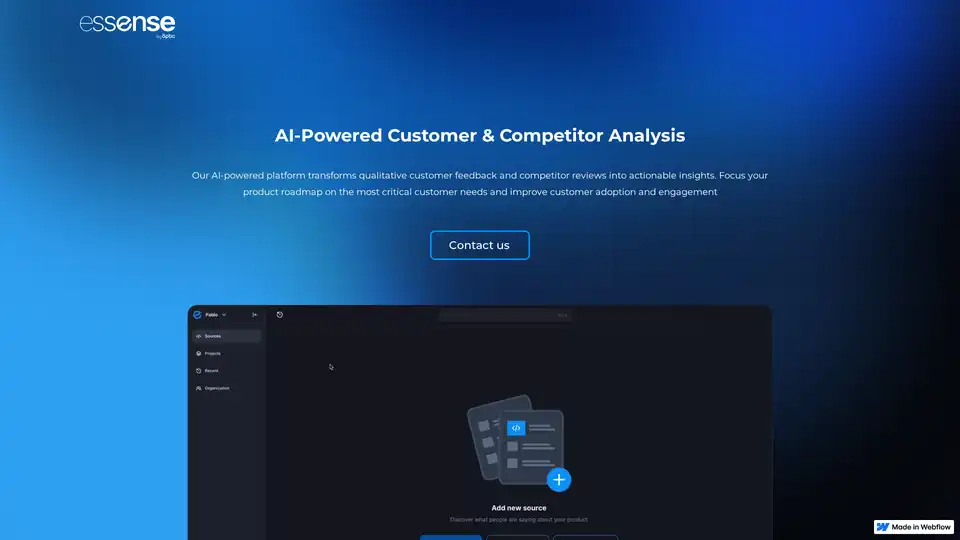
Essense is an AI-powered platform that turns customer feedback and competitor reviews into actionable insights, helping teams prioritize product features, address pain points, and boost adoption for better competitive edge.
Scale qualitative research with AI-powered user interviews. Get instant insights, analyze feedback 10x faster. Trusted by LinkedIn, Ford & Miro. Try free.

Voxpopme is an AI-powered qualitative insights platform that centralizes and analyzes video surveys, interviews, and user research to deliver faster, smarter insights.
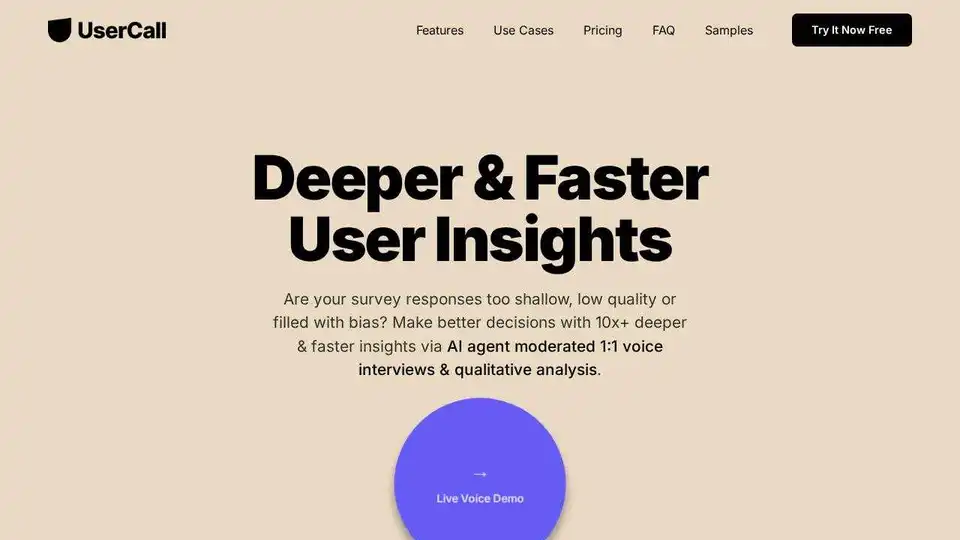
Unlock deep user insights with UserCall, an AI-moderated qualitative data analysis software. Conduct automated voice interviews and gain rich thematic analysis effortlessly.
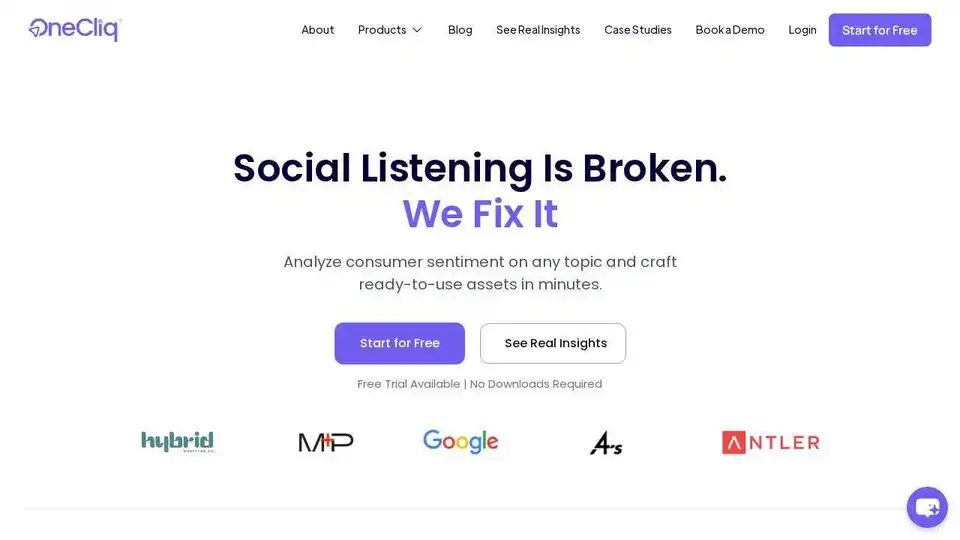
OneCliq.io is a platform for real-time qualitative insights, providing sentiment analysis, narrative analysis, and actionable asset creation in under an hour. Get consumer stories and data-backed insights fast.
Feeedbackr uses AI to analyze user feedback, providing actionable insights for product development. Collect feature requests and understand customer needs with real-time dashboards.