Pie Chart Maker
Overview of Pie Chart Maker
Pie Chart Maker: Create Stunning Visual Charts Online for Free
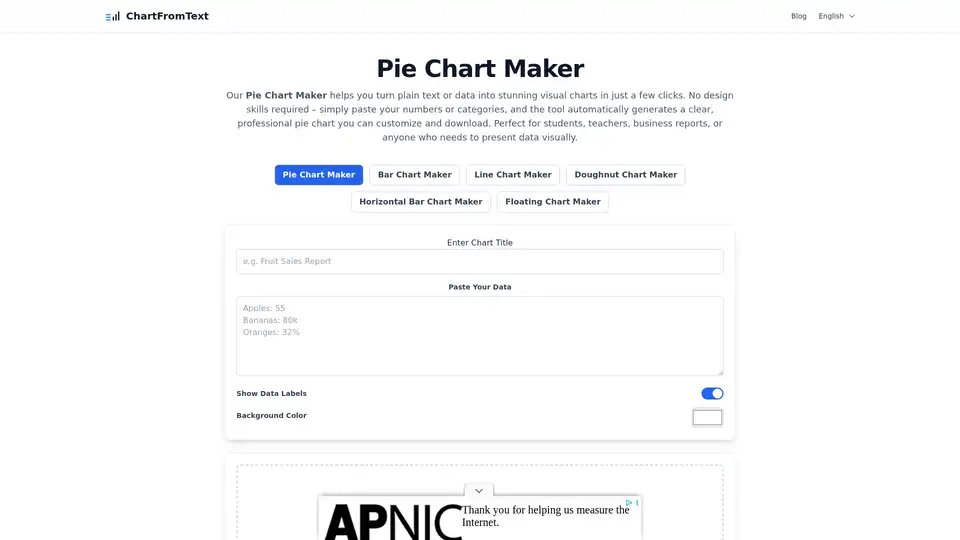
What is the Pie Chart Maker? It's a powerful online tool designed to transform your raw data into visually appealing and easily understandable pie charts. Whether you're a student, teacher, business professional, or anyone needing to present data effectively, this tool simplifies the process, requiring no prior design skills.
How does Pie Chart Maker work?
The Pie Chart Maker allows you to paste your data directly, customize colors, display data labels, and instantly visualize your information. Unlike traditional charting methods that can be time-consuming and complex, this tool provides real-time updates, so you see changes immediately as you modify your data.
Key Features:
- Ease of Use: Intuitive interface with step-by-step guidance.
- Real-Time Updates: Instantly reflects changes to data and settings.
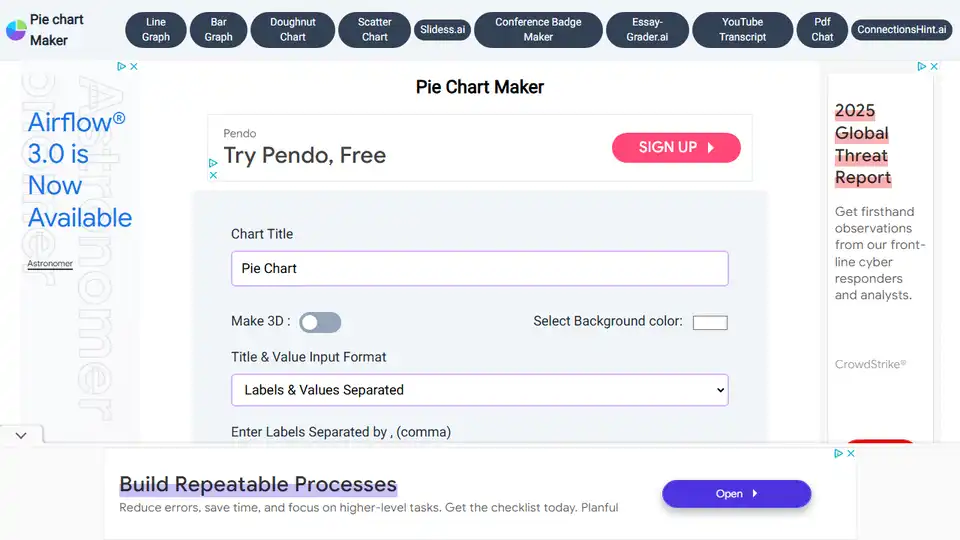
- Customization: Full control over colors, labels, and chart title.
- Download Options: Supports multiple formats for reports, presentations, and web use (PNG, JPEG, etc.)
- Accessibility: Completely online, no installation required, works on all devices.
- Speed: Instant chart generation, even for large datasets.
Where to Use the Pie Chart Maker?
The Pie Chart Maker is versatile and can be used in various scenarios:
- Showing Proportions: Display sales distribution, market share, or budget allocation.
- Budget or Resource Allocation: Visualize budget distribution, team resource allocation, or project time distribution.
- Survey or Poll Results: Perfect for showing the percentage of respondents choosing each option.
- Simple Comparisons: Use pie charts for small datasets with few categories to compare proportions.
How to Make a Pie Chart Using Pie Chart Maker:
- Select Your Chart Type: Choose the type of chart you want to create (pie, bar, line, or doughnut).
- Enter Your Data: Paste your data into the input field. The tool instantly reads your data and generates a chart.
- Customize Your Chart: Adjust colors, toggle data labels, and add a title.
- Preview and Refine: Refine the appearance and highlight key data.
- Download Your Chart: Download your chart in multiple formats.
Pie Chart Maker VS Other Pie Chart Makers
| Feature | Our Pie Chart Maker | Other Pie Chart Makers |
|---|---|---|
| Ease of Use | Intuitive interface, no prior design skills needed. | Cluttered, may require installation, beginners may struggle. |
| Real-Time Updates | Instantly reflects any changes. | Updates may be delayed or require manual refresh. |
| Customization | Full control over colors, labels, and titles. | Limited options. |
| Download Options | Supports multiple formats. | May only allow one format or require third-party tools. |
| Accessibility | Completely online, works on all devices. | Some require downloads or are platform-specific. |
| Speed | Instant chart generation. | May lag with large data or complex charts. |
FAQ
- What is the Pie Chart Maker? An online tool for turning data into pie charts.
- Do I need software? No, it's fully online.
- Can I create charts from text data? Yes, paste your data as text or numbers.
- How do I change colors? Customize each slice with the color picker.
- Can I show or hide data labels? Yes, toggle them on or off.
- Is it possible to edit the title? Absolutely, enter a descriptive title.
- Does it update in real time? Yes, all changes are instantly reflected.
- Can I switch to other chart types? Yes, it supports bar, line, doughnut, and ranking bar charts.
- What formats can I download in? PNG, JPEG, and other common formats.
- Is there a data limit? No, it handles large datasets efficiently.
- Do I need an account? No registration is required.
- Is it good for school or business reports? Yes, it's perfect for students, teachers, analysts, and business professionals.
- Does it work on mobile devices? Yes, it's fully responsive.
- Is my data secure? All data processing happens in your browser.
Why is Pie Chart Maker important? It simplifies data visualization, making it accessible to everyone. It's important because it helps you communicate information clearly and effectively.
Who is Pie Chart Maker for? It is for anyone needing to create professional charts quickly and easily. This tool enhances reports, presentations, and websites with accurate and engaging visuals, suitable for educators, analysts, and business professionals alike. With its user-friendly interface, real-time updates, and versatile customization options, the Pie Chart Maker stands out as the premier choice for transforming data into compelling visual stories.
Best way to visualize your data with Pie Chart Maker? Simply input your data, customize the appearance, and download your chart for use in reports, presentations, or online content.
Best Alternative Tools to "Pie Chart Maker"
Create stunning pie charts for free with Pie Chart Maker. Easy to use tools, customizable options, and download as JPG, PNG, or SVG. Visualize your data effectively.
Capalyze is a data analytics tool that empowers businesses with insights through multi-source integration and web data crawling, driving smarter decisions.
Generate professional diagrams instantly with Diagramming AI. Supports UML, process flows, Mermaid, PlantUML, GraphViz & Excalidraw. Describe your vision and let AI handle the rest.
Agent Zero is an open-source AI framework for building autonomous agents that learn and grow organically. It features multi-agent cooperation, code execution, and customizable tools.
DoubleCloud streamlines data pipelines with fully managed open-source solutions for ingestion to visualization. Build your data analytics infrastructure in one day and save time and costs.

Create professional presentations in minutes with AI Presentation Maker, a free online AI PPT generator. Convert text to presentations effortlessly, ideal for business, education, and creative projects.

Discover Heights AI Coach, an autonomous AI mentor for creators that provides personalized, step-by-step guidance for course creation and business growth, included free with Heights Pro Plan.

Klyra AI is the ultimate all-in-one platform for creating videos, voiceovers, images, blogs, music, and more using advanced AI tools. Boost productivity with seamless content automation and powerful features.
VoxDeck, the next-gen AI presentation maker, lets you ditch generic slides. Access 3D charts to bring your data to life, effortless motion cover, and presentable avatar via simple dialogue. No design skills required—create engaging, attention-grabbing slides easily.

BuildKeeper is modern construction management software with AI-powered features designed for small construction businesses. Streamline tasks, budgets, notes, and expenses to boost efficiency.
Discover essential AI tools and creative resources on Links You Should Know. Level up your creativity with AI music, video, and design inspiration.
Discover ChatGPT Deep Research Free, the top online alternative to OpenAI's Deep Research for those without access. Perform in-depth AI-powered web research, generate detailed reports with citations, and explore complex queries efficiently—all for free.

JuicyAI provides AI assistants for writing, voice synthesis, image generation, and more. Get fresh ideas daily with AI-powered tools for various creative tasks.

Parea AI is the ultimate experimentation and human annotation platform for AI teams, enabling seamless LLM evaluation, prompt testing, and production deployment to build reliable AI applications.