Vizzy
Overview of Vizzy
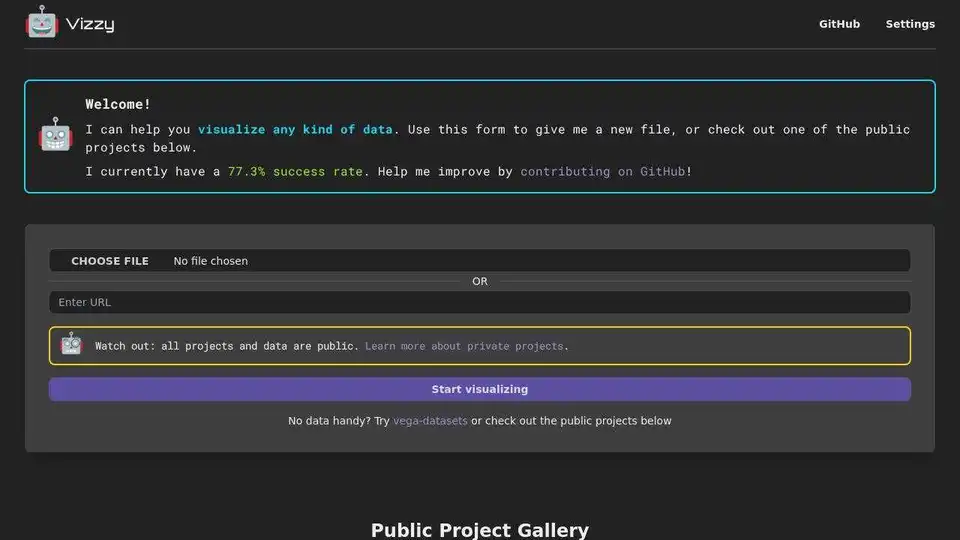
Vizzy: Rapid Data Visualization with LLMs
Vizzy is a web-based tool that empowers users to quickly visualize data using the power of Large Language Models (LLMs). By connecting to OpenAI, Vizzy allows you to transform raw data into insightful visualizations with minimal effort.
What is Vizzy?
Vizzy is a user-friendly platform designed for anyone who needs to explore and understand data visually. It simplifies the data visualization process, making it accessible even to those without extensive data science experience.
How does Vizzy work?
Vizzy leverages LLMs to interpret your data and generate appropriate visualizations. Here's how it works:
- Connect to OpenAI: Vizzy requires an OpenAI API key to function. You can obtain one at platform.openai.com/api-keys. Your API key is securely stored in your browser and not on Vizzy's servers.
- Provide Your Data: Upload your data file to Vizzy. Alternatively, you can explore pre-existing public projects.
- Visualize: Vizzy uses the LLM to analyze your data and create visualizations tailored to the dataset.
Key Features of Vizzy
- LLM-Powered Visualization: Utilizes the capabilities of Large Language Models for intelligent data interpretation and visualization.
- Public Project Gallery: Access and explore a variety of public data visualization projects.
- Easy Data Input: Upload your own data files or use readily available datasets.
- GitHub Integration: Contribute to Vizzy's development and improvement on GitHub.
Why is Vizzy important?
In today's data-driven world, the ability to quickly and effectively visualize data is crucial. Vizzy simplifies this process, allowing users to:
- Gain Insights: Uncover hidden patterns and trends in your data.
- Communicate Effectively: Present data in a clear and understandable format.
- Make Informed Decisions: Use data visualizations to support better decision-making.
Who is Vizzy for?
Vizzy is designed for a wide range of users, including:
- Data Analysts: Quickly explore and visualize data for analysis and reporting.
- Researchers: Visualize research data to identify key findings.
- Students: Learn about data visualization techniques and explore datasets.
- Anyone who needs to understand data: Vizzy makes data visualization accessible to everyone, regardless of their technical expertise.
Public Projects
Vizzy offers a selection of public projects to inspire and demonstrate its capabilities. Some examples include:
- Scripts from TV's "The Office": Contains lines and information from the 'The Office' TV show.
- Same-sex Marriage Legislation Over Time: Tracks changes in same-sex marriage legislation status across several years in various U.S. states.
- U.S. State Obesity Rates: Contains data on obesity rates, shape length and shape area for each U.S. state.
- Cause of Death News Coverage: This data represents the relative frequency of different causes of death, as reported by the CDC, as well as how often those causes of death are mentioned in various news sources.
- U.S. National Parks: Contains information about various national parks in the United States, including geographic, activities, contacts, and more.
How to use Vizzy
- Obtain an OpenAI API key from platform.openai.com/api-keys.
- Enter your API key into the provided field in Vizzy.
- Upload your data file or select a public project.
- Explore the generated visualizations.
Cost Considerations
Vizzy relies on the OpenAI API, so usage incurs charges. Typical usage is less than $1 per project, but it depends on the user behavior and is subject to bugs. It's highly recommended to set spending limits on your OpenAI account.
Contribute to Vizzy
Vizzy is an open-source project. You can contribute to its development by opening an issue or submitting a pull request on GitHub.
What is the best way to visualize your data?
The best way to visualize your data depends on the type of data you have and the insights you're trying to gain. Vizzy helps you explore different visualization options using LLMs to simplify the process. Try it out with various data sets and see what it has to offer. Check out the public project gallery to explore the kind of insights you can derive.
Best Alternative Tools to "Vizzy"
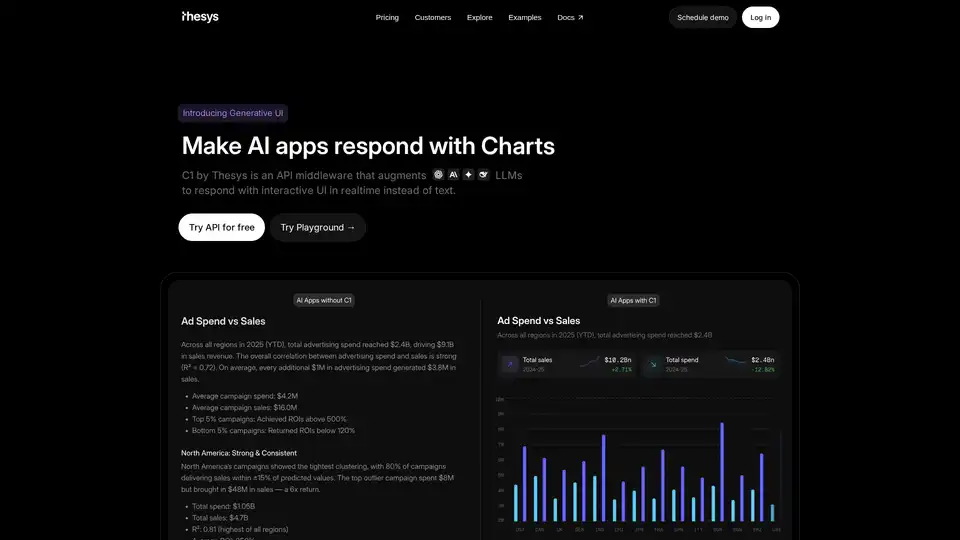
C1 by Thesys is an API middleware that augments LLMs to respond with interactive UI in realtime instead of text, turning responses from your model into live interfaces using React SDK.

Khoj AI is a personal AI research copilot that helps you understand documents, create content, and automate tasks. It supports multiple AI models, offers transparency, and can be accessed anywhere.
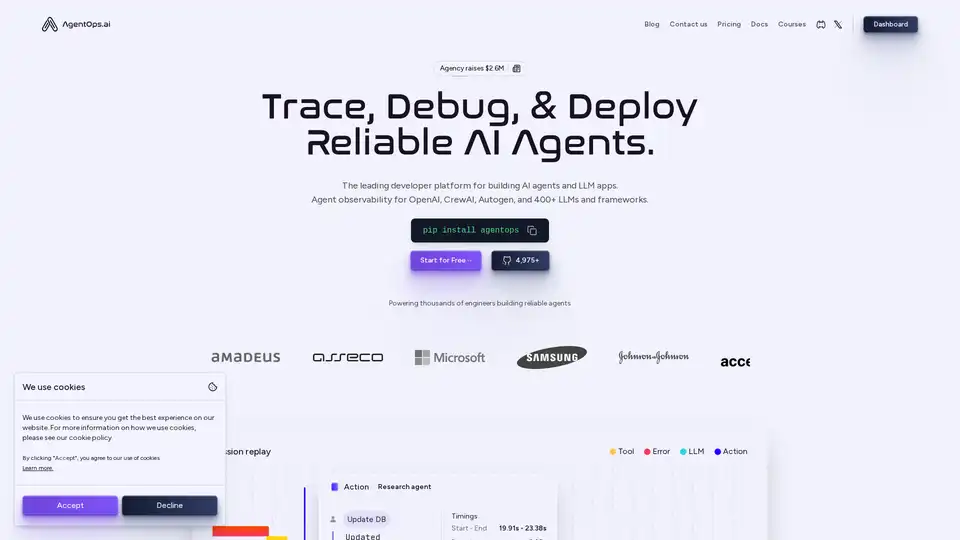
AgentOps is a developer platform for building reliable AI agents and LLM apps. It offers agent observability, time travel debugging, cost tracking, and fine-tuning capabilities.
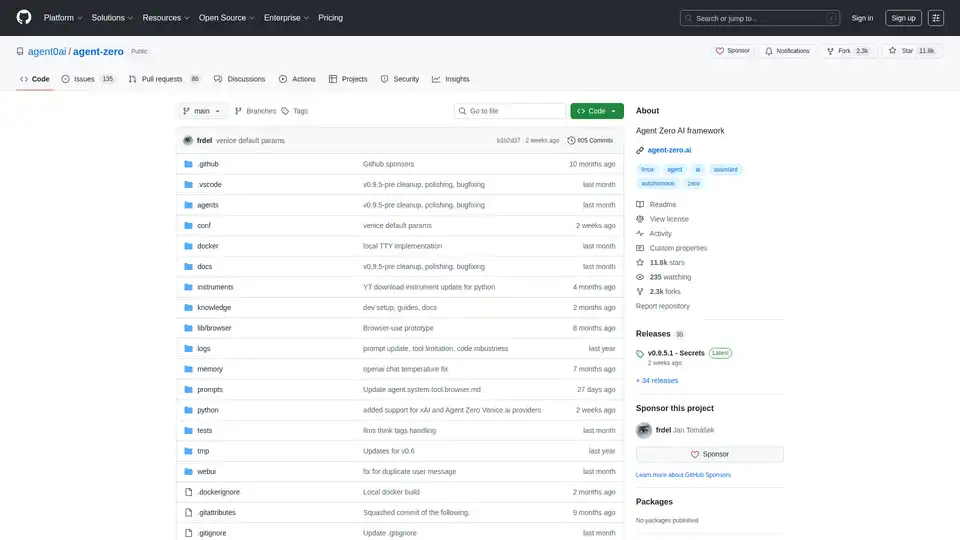
Agent Zero is an open-source AI framework for building autonomous agents that learn and grow organically. It features multi-agent cooperation, code execution, and customizable tools.
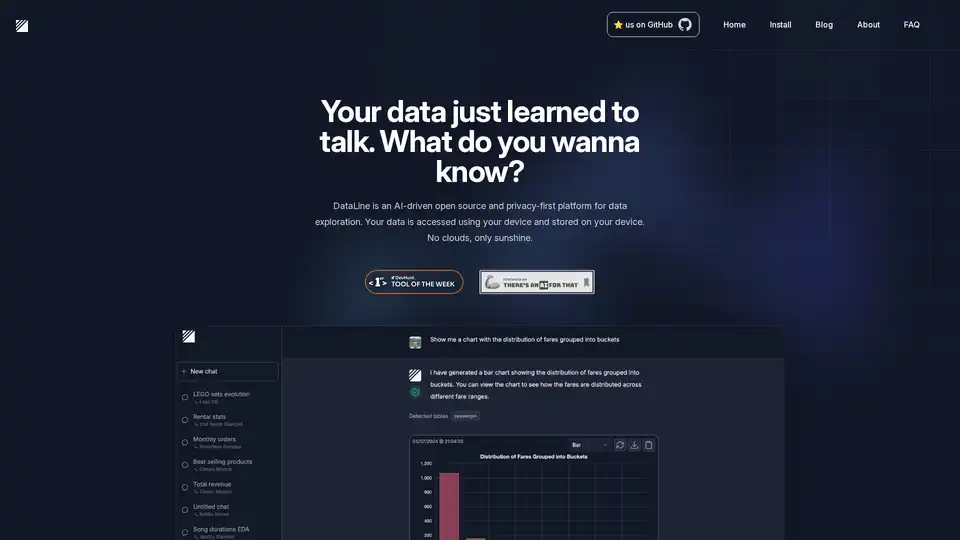
DataLine is an AI-driven, open-source data exploration platform that prioritizes your privacy. Analyze and visualize your data securely on your device without cloud storage.
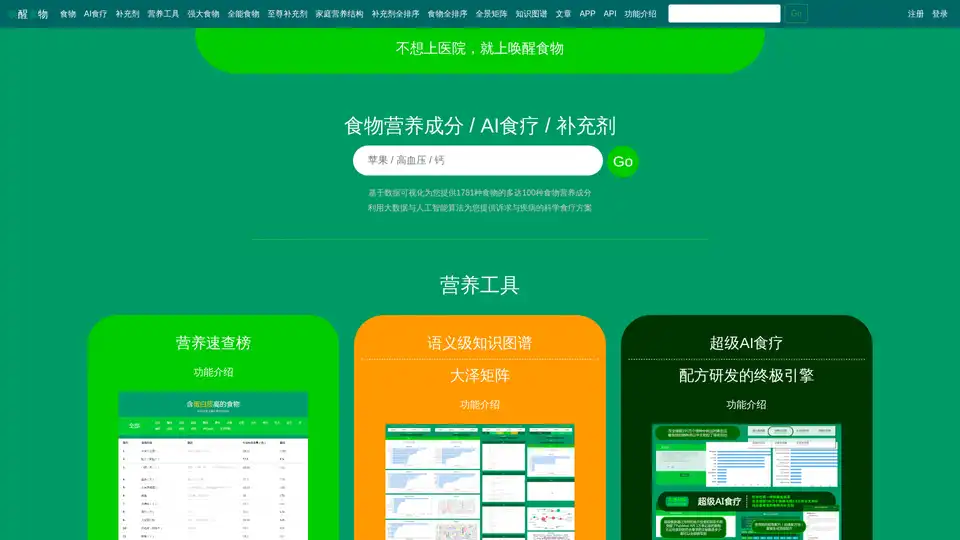
Wake Up Food uses AI and data visualization to deliver comprehensive food nutrition breakdowns and science-based dietary therapy plans for better health management.
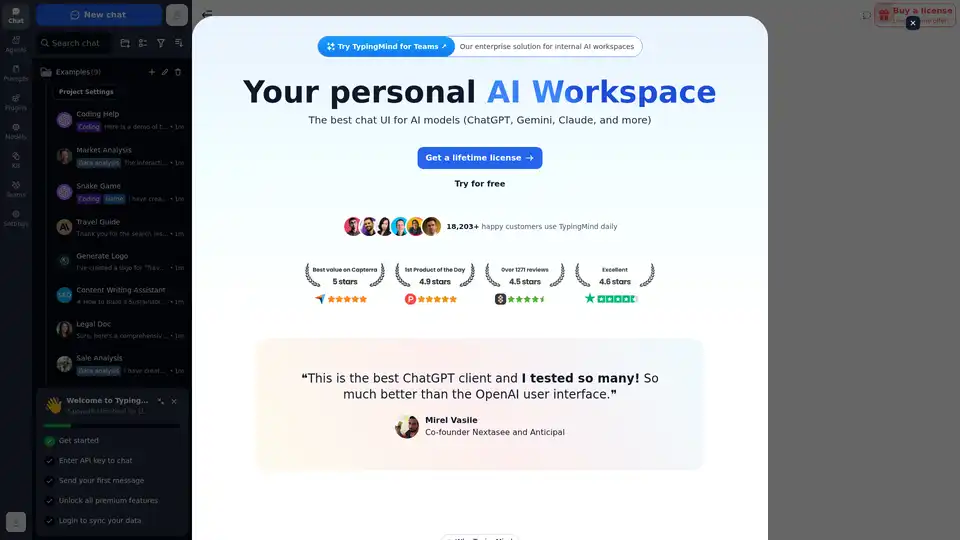
Chat with AI using your API keys. Pay only for what you use. GPT-4, Gemini, Claude, and other LLMs supported. The best chat LLM frontend UI for all AI models.
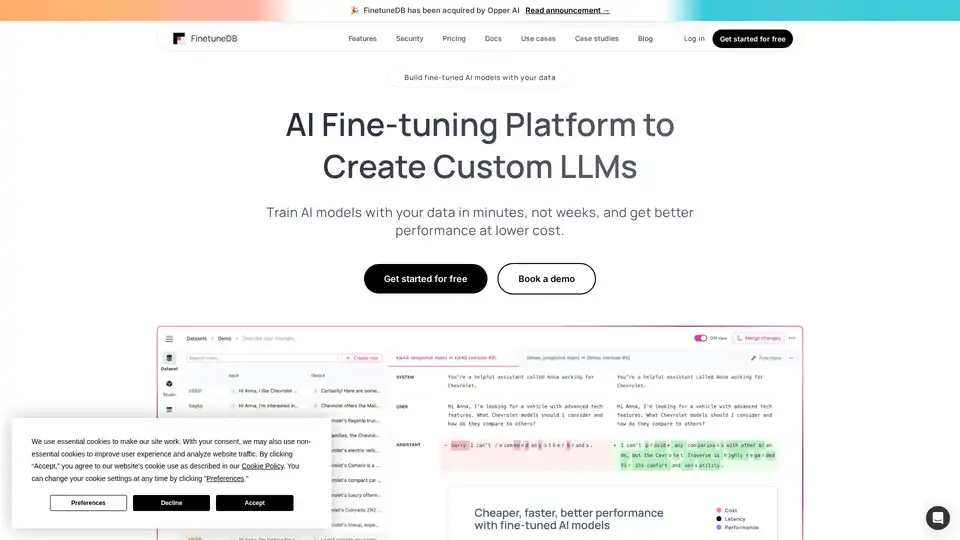
FinetuneDB is an AI fine-tuning platform that lets you create and manage datasets to train custom LLMs quickly and cost-effectively, improving model performance with production data and collaborative tools.
Parea AI is the ultimate experimentation and human annotation platform for AI teams, enabling seamless LLM evaluation, prompt testing, and production deployment to build reliable AI applications.
Alan AI is an Adaptive App AI platform that enables self-coding intelligence for enterprise applications. Deliver features on demand with a self-coding system, reducing developer effort and transforming user experiences.
Soverin is the ultimate AI marketplace for discovering, buying, and leveraging top AI apps and agents. Automate over 10,000 tasks, from building agents to scaling customer support, and boost productivity with trending automation tools.
VerbaGPT empowers you to analyze data using natural language, leveraging LLMs while ensuring data privacy. Ask questions of SQL data, CSVs, or notes and get answers.
Jeda.ai is a multimodal generative visual AI workspace transforming ideas into stunning visuals and data into strategic insights, ideal for ideation and decision-making.
NeoBase is an AI Copilot for Database that lets you query, analyze, and manage databases with natural language. Supports PostgreSQL, MySQL, MongoDB, and more. Open-source and self-hosted.