Reporfy
Overview of Reporfy
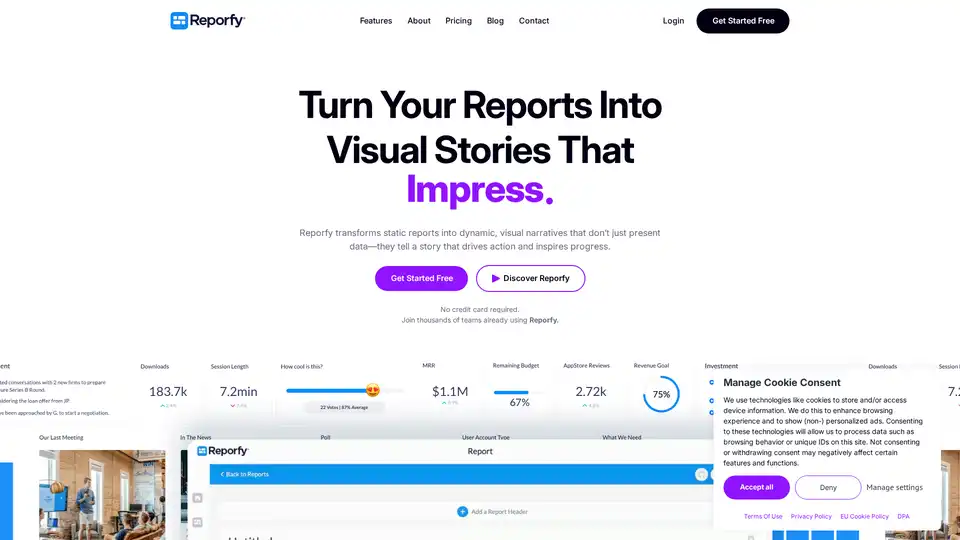
Reporfy: Transform Your Reports Into Visual Stories That Inspire
What is Reporfy? Reporfy is an AI-powered platform designed to transform static reports into dynamic, visual narratives. It goes beyond traditional dashboards by combining quantitative data with qualitative storytelling, helping users create reports that inspire action and drive progress.
Key Features and Benefits
- AI-Powered Reporting: Reporfy's AI acts as a personal analyst, automatically generating report templates, summaries, and intros. This saves time and ensures reports are insightful and actionable.
- Data Visualization: Create stunning visuals that captivate and clarify complex datasets, making it easier for stakeholders to understand and act upon the information.
- Collaborative Reporting: Teams can work together in real-time or asynchronously, with features like threaded discussions and the ability to assign items to teammates.
- Integrations: Seamlessly connects with various tools, from data sources to communication platforms like Slack, ensuring reports are always up-to-date.
- AI Copilot: An AI-powered agent available 24/7 to answer questions, solve doubts, and assist with adding new items to reports.
How Does Reporfy Work?
Reporfy transforms raw data into compelling visual narratives through the power of AI and data storytelling. The platform simplifies complex datasets, blends quantitative data with qualitative storytelling, and offers AI-driven insights to uncover opportunities and solve problems faster.
- Data Input: Connect Reporfy to your data sources, such as spreadsheets, databases, or other platforms.
- AI Analysis: Reporfy's AI analyzes the data and identifies key trends, opportunities, and potential issues.
- Visual Storytelling: Create engaging visuals and narratives that bring your data to life and resonate with stakeholders.
- Collaboration: Share reports with your team and stakeholders, gather feedback, and make informed decisions together.
Why Choose Reporfy?
- From Metrics to Meaning: Reporfy combines the precision of quantitative data with the nuance of qualitative storytelling to create reports that inform and inspire.
- Engaging Stories: Transforms dense information into easy-to-digest visuals that inspire progress and drive results.
- Balanced Approach: Blends the power of numbers with the art of storytelling to make data truly impactful.
- Beyond Just Metrics: Supports collaboration, decision-making, and growth, going beyond traditional dashboards.
Who is Reporfy for?
Reporfy is ideal for marketers, entrepreneurs, and teams that need to create data-driven reports with ease. It’s particularly useful for:
- Marketers: Crafting data-driven reports for marketing campaigns.
- Entrepreneurs: Creating compelling reports to attract investors.
- Data Analysts: Quickly transforming data into actionable insights.
- Teams: Enhancing collaboration and data literacy.
Testimonials and User Reviews
- Prateek Kapoor: "The idea of transforming reporting from a tedious chore into a seamless and insightful process is incredibly compelling."
- Bob Wilsey: "Congratulations on the fantastic launch! It's going to be extremely beneficial for users like me!"
- Emma Turner: "Reporfy has completely transformed how I share progress with my team. It’s intuitive and a joy to use! 🚀"
- Liam Davis: "Beautiful reports in minutes—Reporfy makes storytelling effortless. Highly recommend! ⭐"
- Sophia Miller: "Finally, a reporting tool that feels modern and collaborative. My team loves it! 🙌"
- Noah Bennett: "Reporfy makes data feel exciting and actionable. Our stakeholders are more engaged than ever! 👏"
- Isabella Hayes: "The AI insights are spot on and save me hours of work. I couldn’t imagine going back. 💡"
- Oliver Reed: "Reporfy turned our static updates into engaging, interactive reports. It’s a game-changer! 🔥"
Pricing
Reporfy offers a 14-day free trial with access to all premium features. After the trial, users can subscribe to a plan that best suits their needs. Yearly plans are available, offering savings of up to 20%.
FAQ
- How do I get started? Sign up for a 14-day free trial; no credit card required.
- How do subscriptions work? Subscriptions auto-renew at the end of each billing period (monthly or yearly).
- Do you offer a free trial? Yes, a 14-day free trial is available with access to all features.
- Does Reporfy work on all devices? It is designed to be responsive and works on various devices, but the browser-based desktop version provides the best experience.
Summary
Reporfy is more than just a tool; it’s a partner in transforming the way you see and share progress. Transform your data into stories that inspire action and drive results. Try Reporfy today and experience a new era of data storytelling!
Best Alternative Tools to "Reporfy"
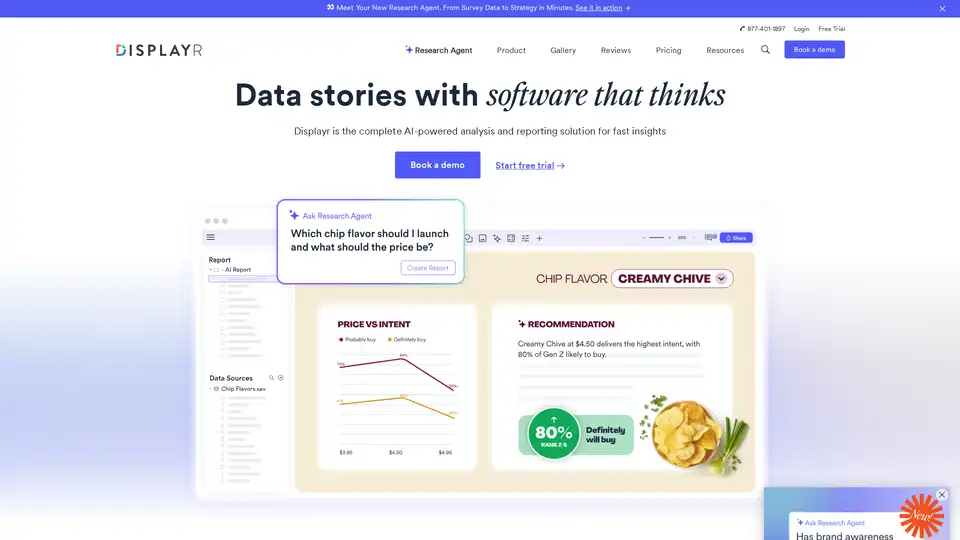
Displayr is an AI-powered analysis and reporting solution transforming data into strategy in minutes. It integrates data, analysis, visualizations, and reports, automating workflows and enhancing insights.

Onnix AI serves as a personalized co-pilot for bankers, accelerating slide deck creation, Excel-based data analysis, and instant queries from financial data providers like FactSet and CapIQ to deliver quick, accurate insights.
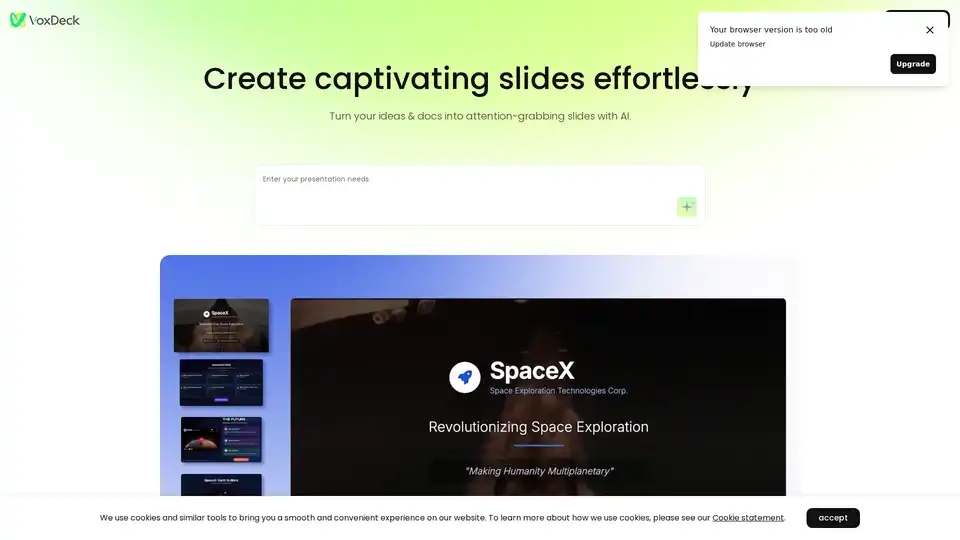
VoxDeck, the next-gen AI presentation maker, lets you ditch generic slides. Access 3D charts to bring your data to life, effortless motion cover, and presentable avatar via simple dialogue. No design skills required—create engaging, attention-grabbing slides easily.
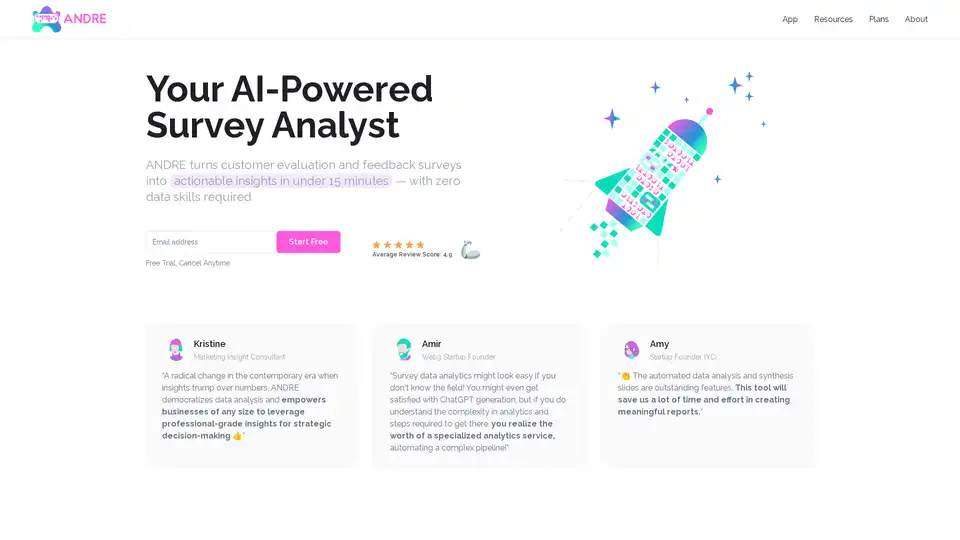
ANDRE is an AI-powered survey data analyst that transforms customer feedback into actionable insights in minutes. It automates data cleaning, analysis, and report creation, requiring no data skills.
Download Concert Creator for free to turn audio into hyper-realistic piano animations and engaging music lessons with AI-powered tools for customization and learning.
Graphy is an AI-powered graph maker that simplifies data storytelling. Create stunning data visualizations from messy data in a click. Trusted by 300,000+ users.
Polymer provides AI-driven embedded analytics via API, enabling seamless integration of real-time, self-service data insights into your product for enhanced user engagement and data-driven decision-making.
Livedocs is your AI data scientist, a collaborative workspace that combines the power of notebooks with the simplicity of an app builder. Use it for data exploration, visualization, and machine learning.
CalcGen AI uses AI to transform data into interactive charts, graphs, and calculators. Upload data tables or images to create visualizations for business and education.
Breadcrumb.ai: AI-powered data analytics platform that automates customer reporting. Turn raw data into actionable insights with no code or data skills required.
Querio: AI-native Business Intelligence platform for querying, analyzing, and reporting data, regardless of technical skill.
Syft Analytics is an AI-first financial reporting platform used by thousands of organizations for dashboards, consolidations, forecasts, and reports, enabling better business decisions.
ExcelDashboardAI transforms Excel files into AI-powered data dashboards and reports in one click. Unlock data insights with AI-driven analysis and visualizations.
Algo is a data-visualization studio specializing in AI-driven video automation, turning data into videos at scale for marketing and editorial projects.