Graphy
Overview of Graphy
Graphy: The AI Graph Maker for Stunning Data Visualizations
What is Graphy?
Graphy is an AI-powered platform designed to simplify data storytelling by enabling users to create beautiful and insightful graphs from raw data with just a click. It's trusted by over 300,000 users, ranging from marketers to finance professionals, who rely on clear and compelling data visualizations to drive decision-making.
How does Graphy work?
Graphy's AI engine intelligently analyzes uploaded data, automatically identifying key insights and presenting them in visually appealing charts. Here’s a step-by-step breakdown:
- Data Input: Users can upload data from various sources, including live Google Sheets, CSV/Excel files, direct input, API calls, or even AI-driven data searches. No data preparation or formatting is required.
- AI-Powered Analysis: Graphy's data engine scans the dataset, highlights crucial insights, and explains the reasoning behind them, ensuring transparency and trust.
- Customization: Users can brand charts with their company's colors and fonts, and add annotations to emphasize key points.
- Sharing & Exporting: Charts can be easily exported or embedded into presentations, social media posts, documents, and dashboards.
Why is Graphy important?
In today's data-driven world, the ability to communicate insights effectively is crucial. Graphy addresses this need by offering:
- Actionable Insights: Transforming raw data into clear and actionable insights.
- Reduced Ambiguity: Eliminating confusion through visually compelling charts.
- Faster Decisions: Accelerating decision-making with readily understandable data.
- Stronger Alignment: Fostering shared understanding and alignment across teams.
Who is Graphy for?
Graphy is ideal for a wide range of professionals, including:
- Marketers: Creating engaging social media posts and marketing reports.
- Finance Professionals: Building clear and concise financial dashboards.
- Data Analysts: Quickly visualizing and presenting data insights.
- Business Leaders: Communicating data-driven strategies to teams and stakeholders.
Best way to visualize your data?
With Graphy, you can transform your data into compelling stories that drive action. Some of the popular ways to use Graphy include:
- Presentations: Creating visually appealing slides that communicate data effectively.
- Social Media: Sharing engaging insights that capture attention and drive engagement.
- Internal Documents: Providing clarity and direction for teams working with data.
- Status Updates: Keeping teams informed with visually rich and easily digestible information.
Key Features of Graphy
- AI-Powered Insights: Graphy's AI engine automates the process of discovering and visualizing key data insights.
- Custom Branding: Brand your charts with your company's colors and fonts for a consistent visual identity.
- Data Integration: Connects with various data sources, including Google Sheets, Excel, and APIs.
- Easy Sharing: Export and embed charts in presentations, reports, and social media.
User Testimonials
- Cindy Ibanez, Global Head of Marketing at Wynwood House: "Thanks to Graphy, 5 days of reporting were done in 4 hours. My team were in love! They were like, oh my God, what is this, this is the future!"
- Joe Edwards, Senior Growth Marketing Manager at Venafi: "Graphy helps you create stunning charts from disparate sources with the context and commentary your stakeholders need."
- Ryan Hoover, Founder of Product Hunt: "I’d rather eat cardboard than create another pivot table. Thanks, Graphy (I don’t like cardboard)"
Graphy simplifies data storytelling, making it accessible to everyone. Transform your data into beautiful, insightful visuals and drive better decisions today. Give Graphy a try and see how it can transform the way you work with data.
Best Alternative Tools to "Graphy"
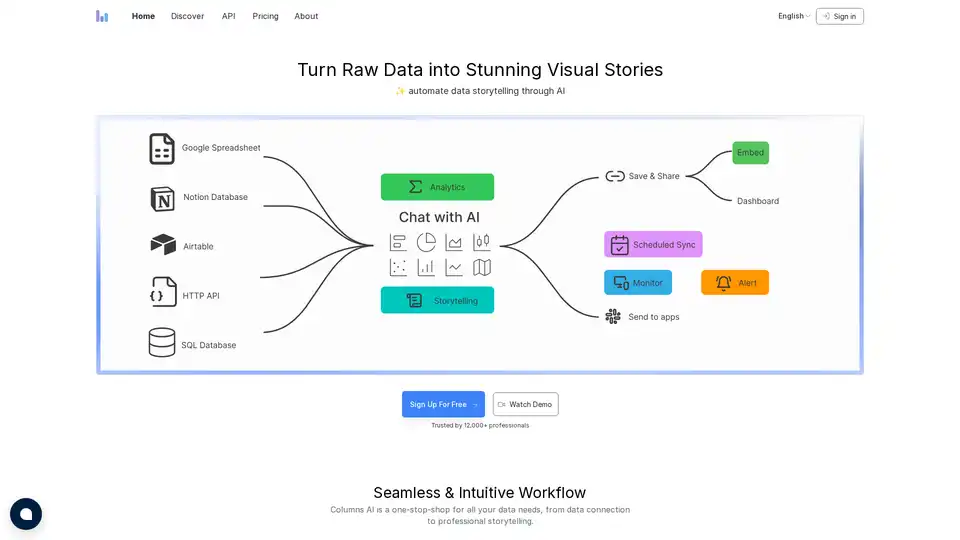
Columns AI is a data visualization platform that automates data storytelling using AI. It allows users to connect to various data sources, transform data into visual narratives, and share insights with teams and clients.
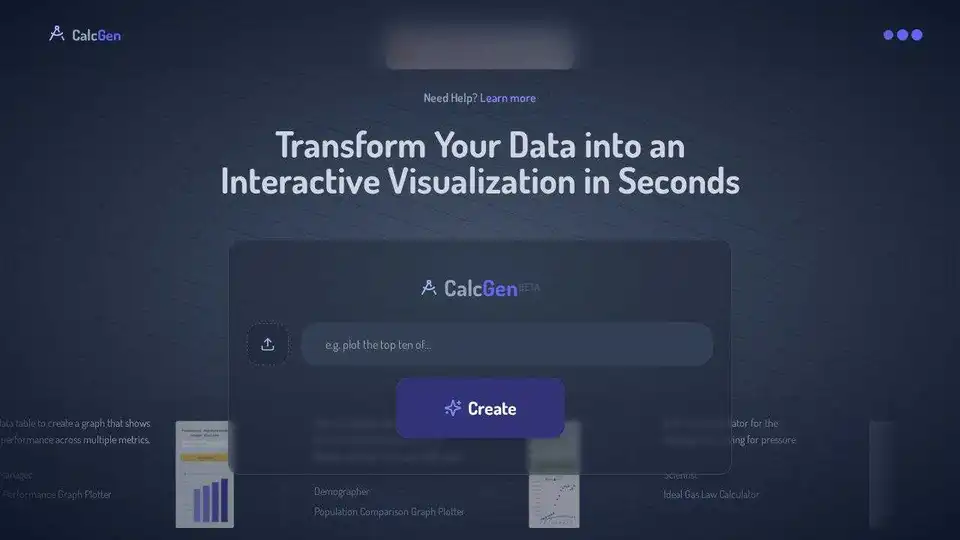
CalcGen AI uses AI to transform data into interactive charts, graphs, and calculators. Upload data tables or images to create visualizations for business and education.
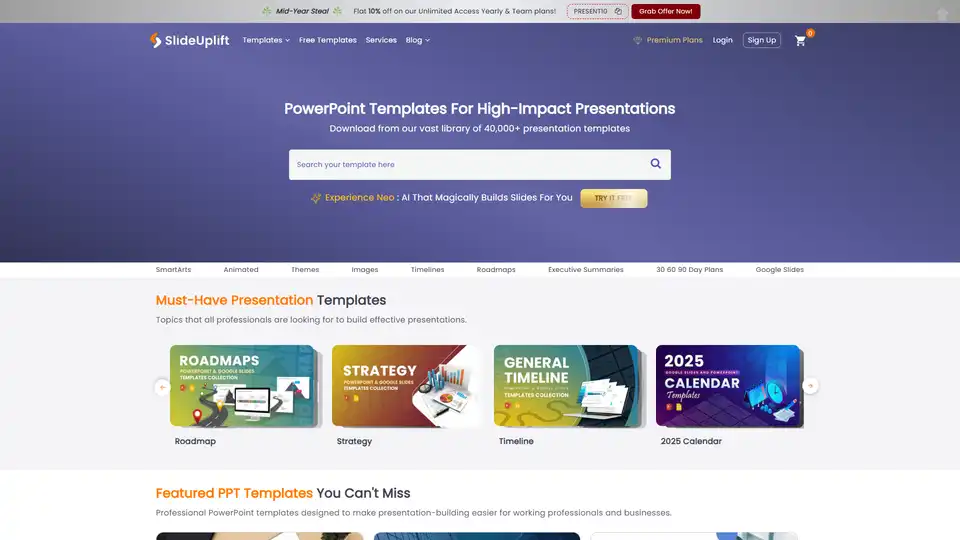
Explore SlideUpLift's PowerPoint templates for impactful presentations. Download customizable PPT templates to enhance your presentations with ease and style. Use AI editor to build world-class presentations.
Polymer provides AI-driven embedded analytics via API, enabling seamless integration of real-time, self-service data insights into your product for enhanced user engagement and data-driven decision-making.
Uncover hidden trends and patterns in your data effortlessly with Grapha.ai, your AI data science copilot.
FlowCraft is an AI-powered diagramming tool that transforms text descriptions into stunning visuals including flowcharts, infographics, and concept diagrams. Perfect for content creators, business professionals, and educators.
Create interactive charts with AI Graph Maker. Turn your data to custom bar charts, line charts, flowcharts, pie charts and scatter plots with AI effortlessly.
ChartFast is an AI data analyst tool that automates data visualization and analysis. It generates precise graphs in seconds, saving time and resources for data professionals.
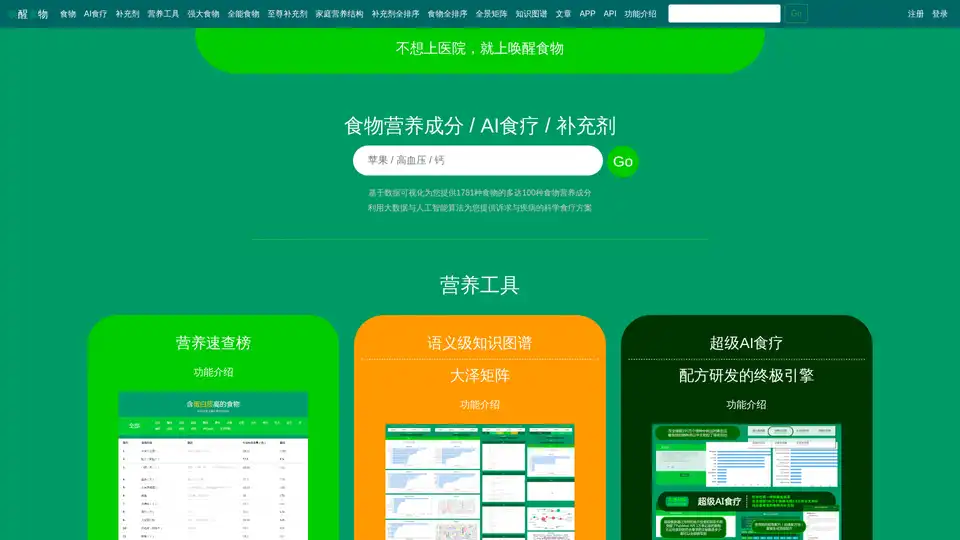
Wake Up Food uses AI and data visualization to deliver comprehensive food nutrition breakdowns and science-based dietary therapy plans for better health management.
ChartFast is an AI data analyst tool designed to streamline data visualization and analysis tasks. Generate precise graphs in seconds and automate repetitive data work.
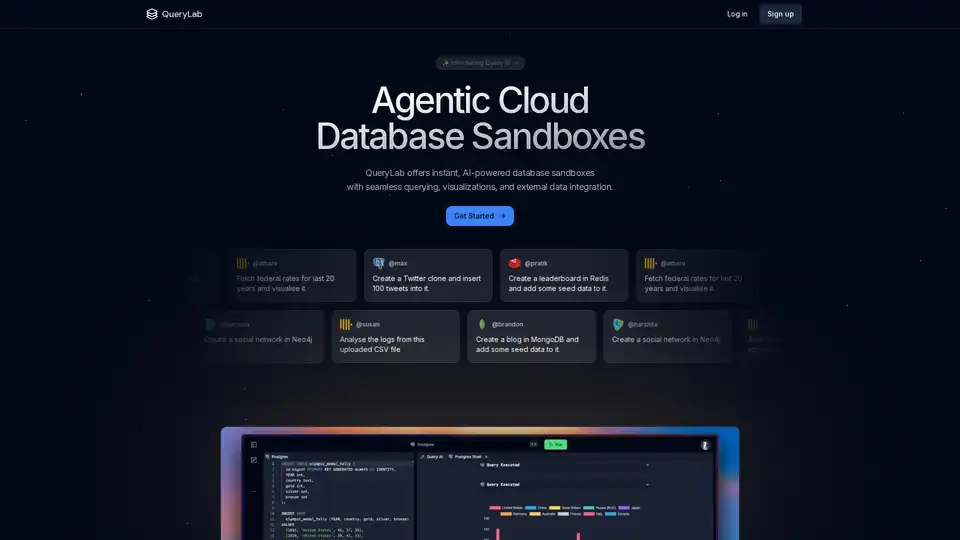
QueryLab provides instant AI-powered database sandboxes for querying, visualization, and external data integration. It simplifies data interaction using natural language and AI-driven automation.
Biolytics App: Import lab tests, access insights for each biomarker. Track evolution, understand meaning with AI-powered data visualization.
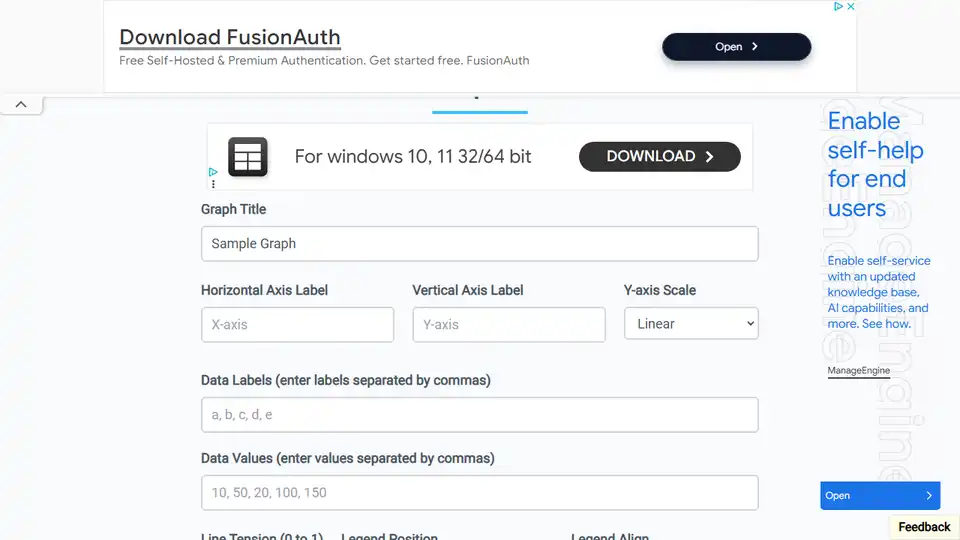
Line Graph Maker online. Create a line graph for free with easy to use tools and download the line graph as jpg or png file. Customize line graph according to your choice.
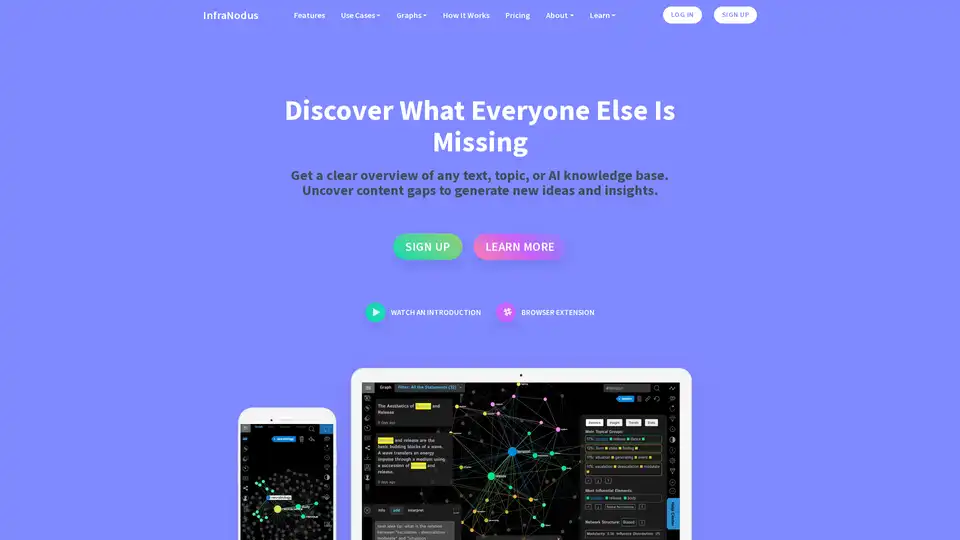
InfraNodus is an AI text analysis tool that leverages knowledge graphs to visualize texts, uncover content gaps, and generate new insights for research, ideation, and SEO optimization.