Columns AI
Overview of Columns AI
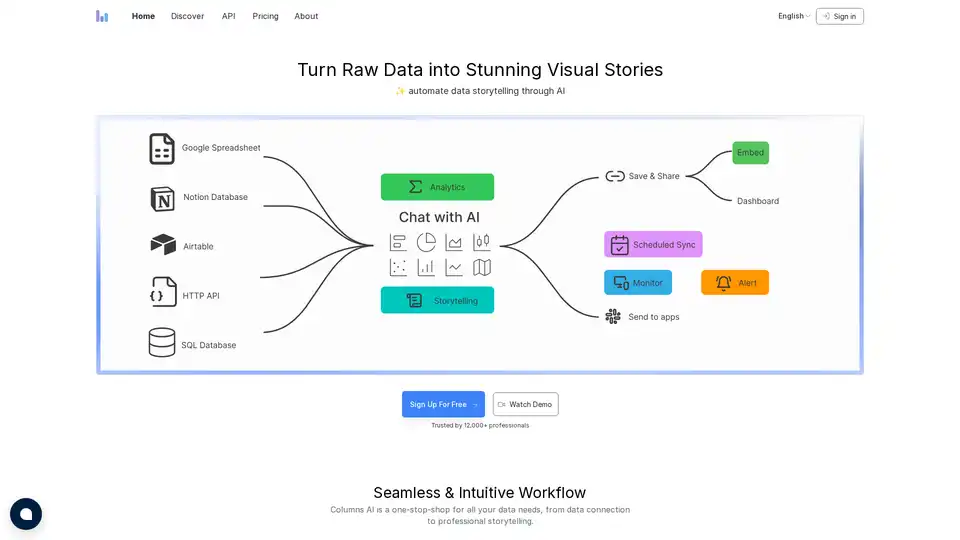
Columns AI: Automate Data Storytelling with AI
What is Columns AI? Columns AI is a cutting-edge data visualization platform designed to automate data storytelling through the power of artificial intelligence. It transforms raw data into visually stunning and easily understandable stories, making data insights accessible to everyone. Whether you're a business analyst, marketer, blogger, or executive, Columns AI simplifies complex data into clear, actionable insights.
How does Columns AI work?
Columns AI operates through a seamless and intuitive workflow, connecting to various data sources, transforming data into compelling visual narratives, and providing easy sharing options. Here's a breakdown:
- Data Integration: Connect to multiple data sources, including Google Sheets, Notion, Airtable, HTTP APIs, SQL databases, Excel files, and CSV files.
- Data Transformation: Leverage AI to effortlessly transform your data into visual stories.
- Professional Storytelling: Build stunning content with Canva-like tools, enhanced by AI-produced titles and summaries.
- Show & Tell: Share links, embed views, export as SVG/PNG, add comments, or turn it into a dynamic dashboard page.
- Automation: Schedule automatic updates to keep your visual stories aligned with your data.
- API: Replicate graph templates with new data and instantly create shareable URLs.
Key Features of Columns AI
- AI Chat: Ask questions in natural language and get answers as visualizations.
- Live Connection: Save and reuse shareable data sources.
- HTTP API: Pull data from any app, tool, or website seamlessly.
- SQL DB: Use SQL queries as live data sources.
- Theme: Request unique themes or visual styles with a simple prompt.
- Variants: Render data in percentage, accumulated, or other views.
- Time Series: Analyze time series data with simple clicks.
- Histogram: Generate histograms with a single sentence.
- Embed: Easily integrate visualizations anywhere with iframe code.
- Export: Save as PNG, SVG, or CSV.
- Customization: Embed graphs with or without the crown.
- Protection: Control access with domain whitelisting.
- Links: Generate unique links for each graph or presentation deck.
- Presentation: Create and share decks featuring your visualizations.
- Collaboration: Share secure data links for interactive exploration.
- Schedule: Automatically update your graphs on a set schedule.
- Fresh Data: Start every new story with the latest data.
- Live Updates: Embedded graphs always stay up to date.
Why Choose Columns AI?
Columns AI simplifies data insights communication, making it easy to share data-driven stories with your team, clients, or the world. It eliminates the complexity of traditional data visualization tools, allowing users to focus on insights and storytelling rather than struggling with technical details.
- Business Analysis: Transforms complex data into clear, actionable insights for better decision-making.
- Marketing & Operation Analysis: Provides deep insights into marketing performance and operational efficiency with AI-powered data visualization.
- Embed Stories in Website: Seamlessly integrates interactive data visualizations into your website, enhancing user engagement.
- Bloggers Enrich Writings: Creates compelling, data-driven narratives with easy-to-embed, visually stunning data graphics.
- Business Owners Make Decisions: Simplifies complex data into easy-to-understand visualizations that reveal the true performance of your business.
- Executives Communicate Insights: Creates impactful, professional presentations that communicate key insights with clarity and precision.
- Consultants Deliver Reports: Quickly generates professional, client-ready data reports that showcase analytical expertise.
Who is Columns AI for?
Columns AI is designed for a wide range of users, including:
- Business Analysts: To transform data into actionable insights.
- Marketers: To gain insights into marketing performance and customer engagement.
- Bloggers: To enrich content with data-driven narratives.
- Executives: To communicate key insights with clarity and precision.
- Consultants: To deliver professional data reports that drive results.
Columns AI Pricing
Columns AI offers simple and transparent pricing plans:
- Premium: $75 USD/year, offering unlimited visual graphs, embedding, secure data sharing, 10 slide decks, and data sync every 6 hours.
- Platinum: $180 USD/year, offering unlimited visual graphs, embedding, secure data sharing, unlimited slide decks, unlimited API calls, and data sync every 1 hour.
Best way to use Columns AI?
The best way to leverage Columns AI is by connecting it to your existing data sources, exploring the AI Chat feature for quick insights, and crafting compelling visual stories with the drag-and-drop interface. Embed these stories into your website, presentations, or reports to share data-driven insights effectively.
Final Thoughts
Columns AI offers a modern, AI-driven solution to data storytelling, making it easier than ever to transform raw data into stunning visual narratives. It is a one-stop-shop for all your data needs, from data connection to professional storytelling, offering a user-friendly experience that empowers users to make informed decisions and communicate insights effectively. Don’t look back at traditional tools – step forward with Columns AI and unlock 10x business efficiency.
Best Alternative Tools to "Columns AI"
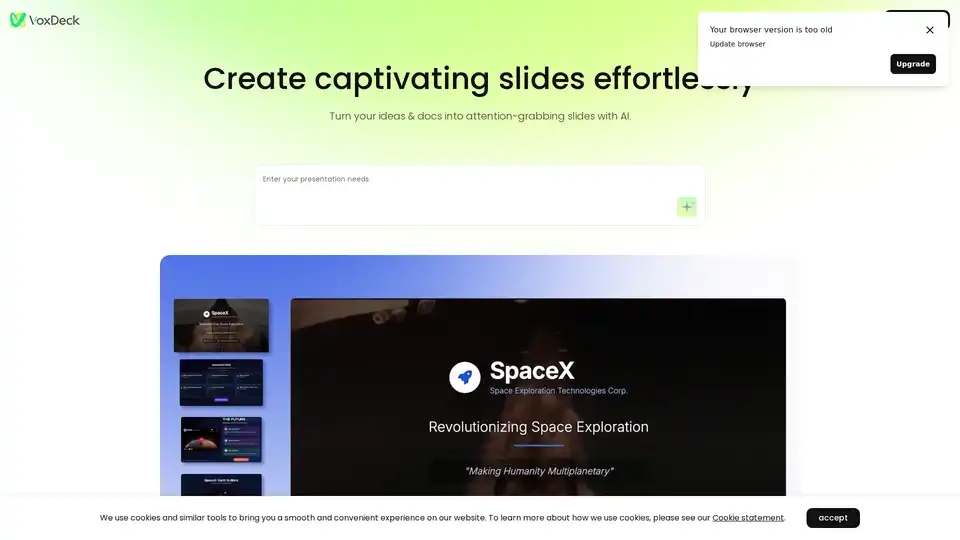
VoxDeck, the next-gen AI presentation maker, lets you ditch generic slides. Access 3D charts to bring your data to life, effortless motion cover, and presentable avatar via simple dialogue. No design skills required—create engaging, attention-grabbing slides easily.
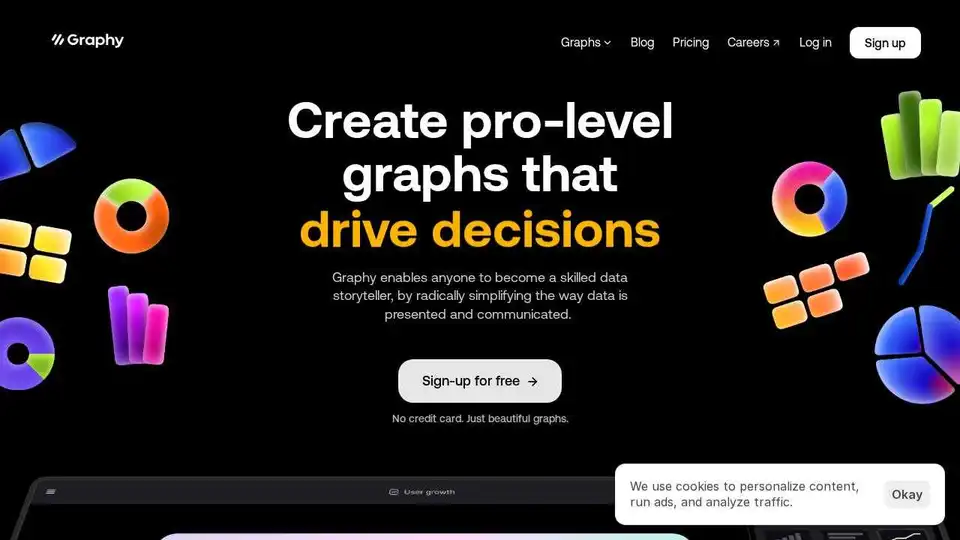
Graphy is an AI-powered graph maker that simplifies data storytelling. Create stunning data visualizations from messy data in a click. Trusted by 300,000+ users.
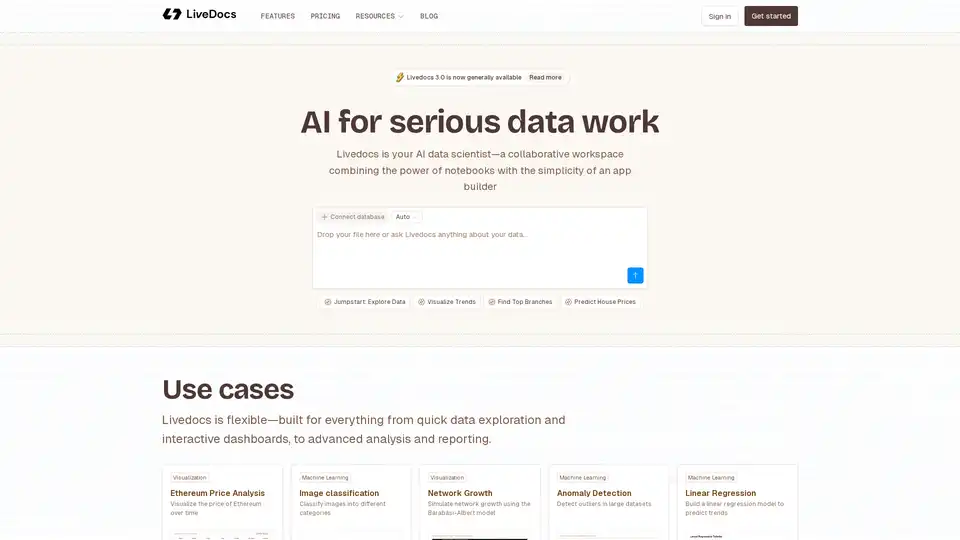
Livedocs is your AI data scientist, a collaborative workspace that combines the power of notebooks with the simplicity of an app builder. Use it for data exploration, visualization, and machine learning.
StatPecker is an AI-powered tool that provides smart business insights and stunning visuals. Extract trends, analyze CSVs, and create shareable infographics effortlessly. Perfect for content creators.
Displayr is an AI-powered analysis and reporting solution transforming data into strategy in minutes. It integrates data, analysis, visualizations, and reports, automating workflows and enhancing insights.

Jeda.ai is a multimodal generative visual AI workspace transforming ideas into stunning visuals and data into strategic insights, ideal for ideation and decision-making.
ML Clever: AI Data Analytics Platform for instant dashboards, AutoML, and predictive insights without code. Alternative to complex BI & Data Science platforms.
FlowCraft is an AI-powered diagramming tool that transforms text descriptions into stunning visuals including flowcharts, infographics, and concept diagrams. Perfect for content creators, business professionals, and educators.
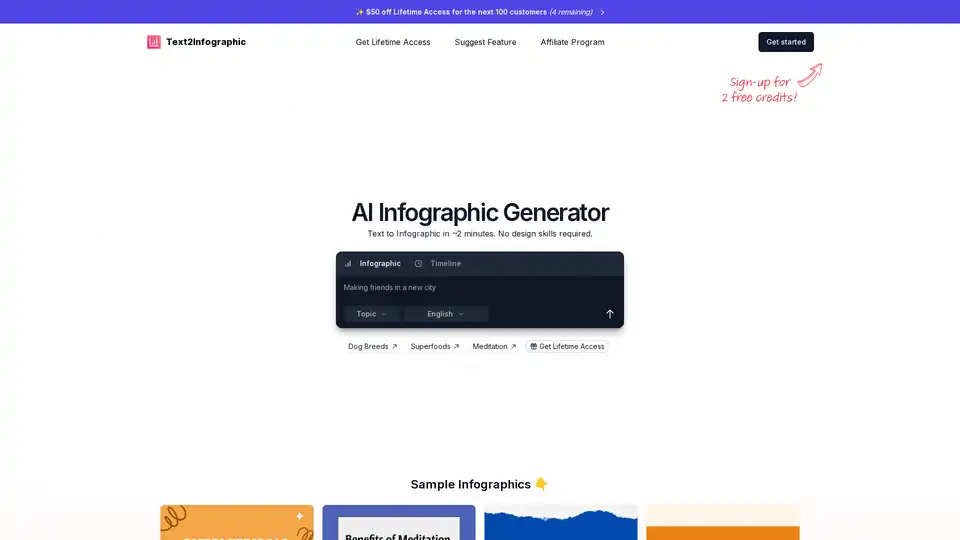
Text to Infographic is an AI Infographic Generator that turns your text into visuals for your blog, social media, and more.
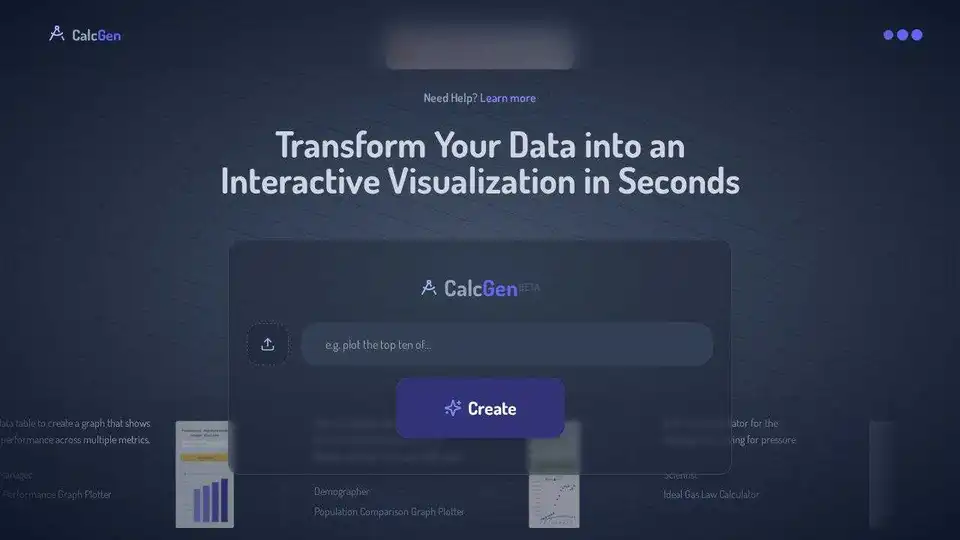
CalcGen AI uses AI to transform data into interactive charts, graphs, and calculators. Upload data tables or images to create visualizations for business and education.
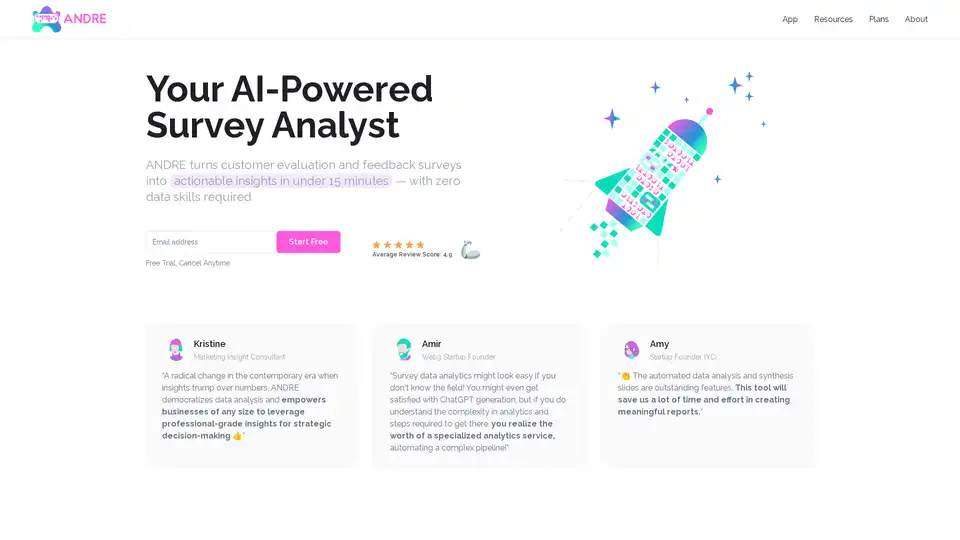
ANDRE is an AI-powered survey data analyst that transforms customer feedback into actionable insights in minutes. It automates data cleaning, analysis, and report creation, requiring no data skills.
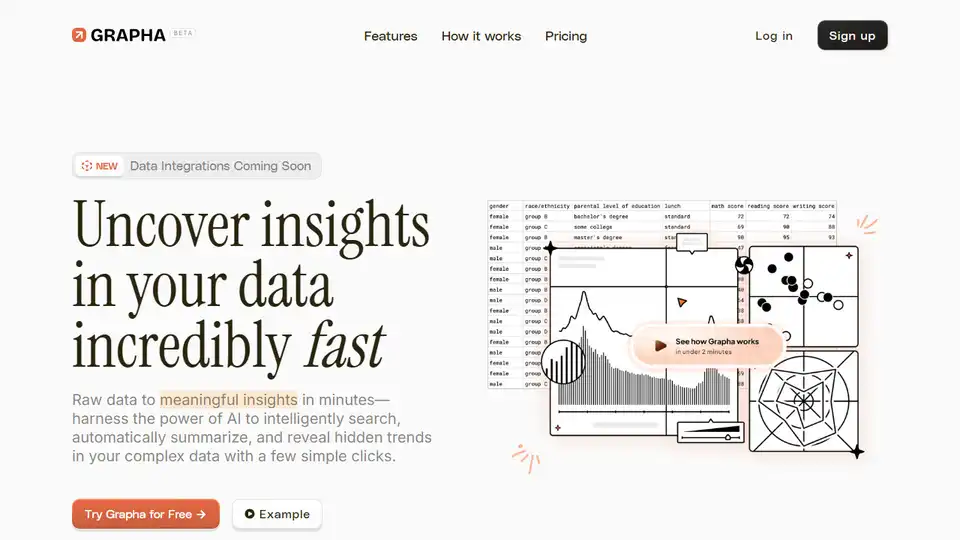
Uncover hidden trends and patterns in your data effortlessly with Grapha.ai, your AI data science copilot.
Polymer provides AI-driven embedded analytics via API, enabling seamless integration of real-time, self-service data insights into your product for enhanced user engagement and data-driven decision-making.

Onnix AI serves as a personalized co-pilot for bankers, accelerating slide deck creation, Excel-based data analysis, and instant queries from financial data providers like FactSet and CapIQ to deliver quick, accurate insights.