Excel Dashboard Ai
Overview of Excel Dashboard Ai
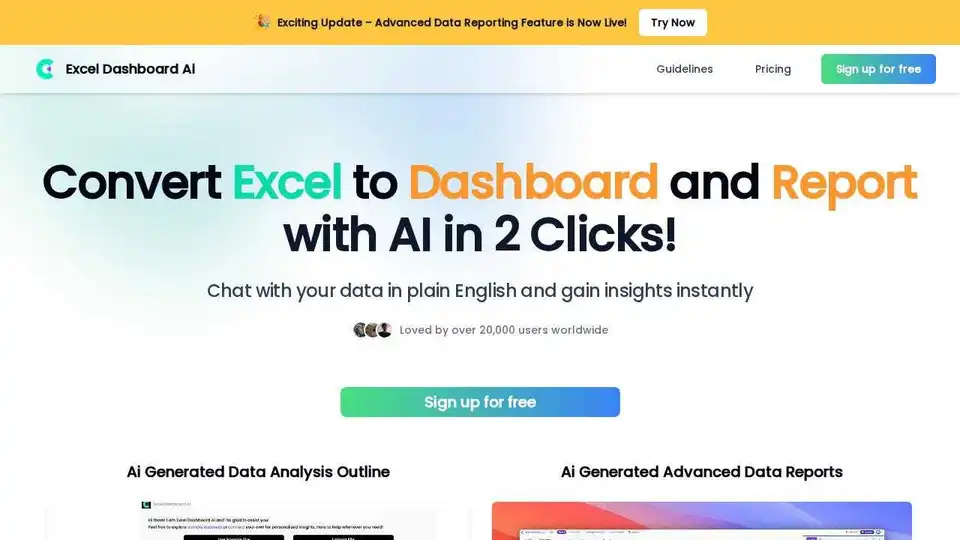
ExcelDashboardAI: Transform Excel Data into Interactive AI Dashboards Instantly
What is ExcelDashboardAI? ExcelDashboardAI is an AI-powered tool designed to instantly convert Excel files into interactive data dashboards and comprehensive analysis reports. It empowers users to unlock valuable insights from their data with just a single click, eliminating the need for complex programming or data visualization skills.
How does ExcelDashboardAI work? ExcelDashboardAI leverages artificial intelligence to automate the process of data analysis and visualization. Here’s a breakdown of its key functionalities:
- Data Import: Simply upload your Excel file to the platform.
- AI-Powered Analysis: The AI algorithms automatically explore diverse data dimensions and generate multiple analysis perspectives.
- Interactive Dashboard Creation: With a single click, ExcelDashboardAI creates an interactive dashboard with charts, graphs, and key performance indicators (KPIs).
- Natural Language Interaction: Users can interact with the dashboard using natural language commands to generate new charts, ask questions, and gain immediate answers.
- Report Generation: Convert the dashboard into a detailed, 20+ page report with fully editable charts for easy customization.
Key Features of ExcelDashboardAI:
- One-Click Dashboard Generation: Transform Excel data into interactive dashboards instantly.
- AI-Driven Insights: Let AI explore data dimensions and highlight key information.
- Natural Language Interface: Generate charts and ask questions using natural language commands.
- Automated Report Generation: Convert dashboards into comprehensive, editable reports.
- Batch Analysis: Explore diverse data dimensions easily and efficiently.
Who is ExcelDashboardAI for?
ExcelDashboardAI is ideal for a wide range of users, including:
- Business Analysts: Quickly analyze data and generate insights for informed decision-making.
- Data Scientists: Automate data visualization and report generation to focus on more complex tasks.
- Marketing Professionals: Track campaign performance and identify trends with interactive dashboards.
- Educators and Students: Visualize data and gain a deeper understanding of complex topics.
- Anyone who works with Excel data: Simplify data analysis and visualization without requiring programming skills.
Benefits of Using ExcelDashboardAI:
- Saves Time and Effort: Automate data analysis and report generation, freeing up valuable time.
- Unlocks Data Insights: Discover hidden trends and patterns in your data with AI-powered analysis.
- Enhances Data Visualization: Create interactive dashboards that make data easier to understand and communicate.
- Improves Decision-Making: Gain access to data-driven insights for more informed decisions.
- Reduces Technical Barriers: Simplify data analysis for users without programming or data visualization expertise.
Real-World Examples of ExcelDashboardAI Usage:
- Global Education Data Insights Report: Visualize and analyze global education data to identify trends and patterns.
- E-commerce Customer and Sales Analytics: Track customer behavior, sales performance, and marketing campaign effectiveness with interactive dashboards.
How to Get Started with ExcelDashboardAI:
- Sign up for a free account on the ExcelDashboardAI website.
- Upload your Excel file.
- Let AI analyze your data and generate an interactive dashboard.
- Explore the dashboard, ask questions, and generate reports.
Conclusion:
ExcelDashboardAI is a powerful AI-driven tool that simplifies data analysis and visualization for users of all skill levels. By transforming Excel data into interactive dashboards and comprehensive reports, it empowers users to unlock valuable insights and make more informed decisions. What are you waiting for? Sign up today and see how ExcelDashboardAI can transform your data analysis workflow.
Best Alternative Tools to "Excel Dashboard Ai"
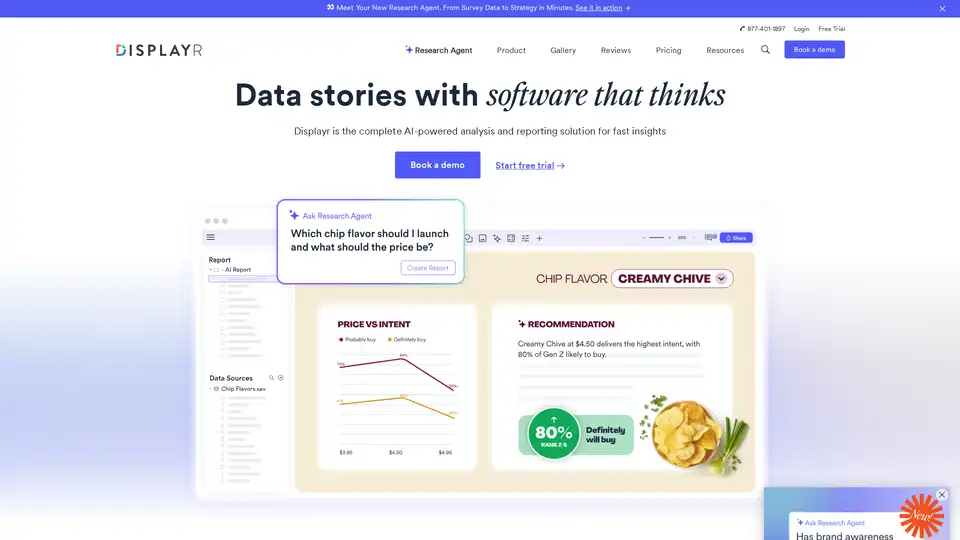
Displayr is an AI-powered analysis and reporting solution transforming data into strategy in minutes. It integrates data, analysis, visualizations, and reports, automating workflows and enhancing insights.
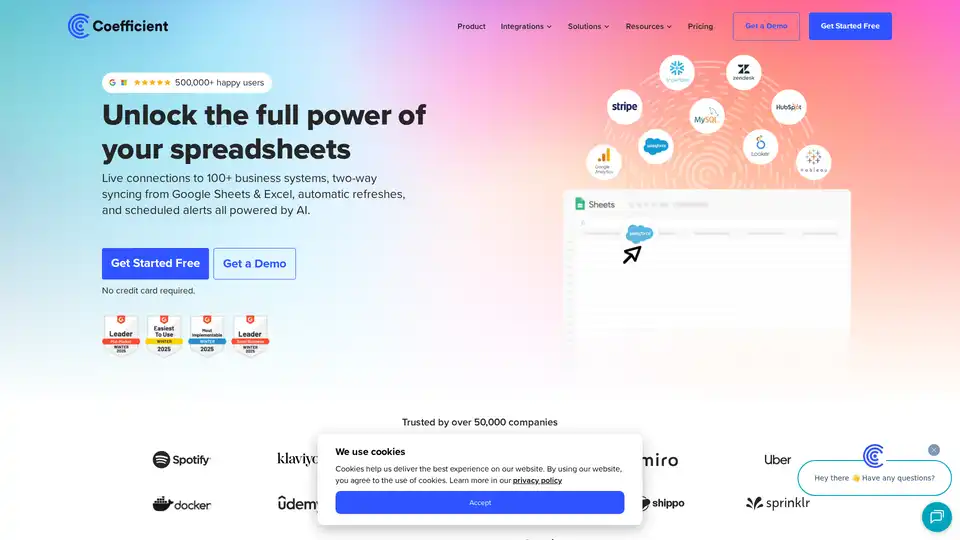
Coefficient connects Google Sheets & Excel to 100+ business systems, enabling live data syncing, automated refreshes, and AI-powered insights for streamlined reporting and data analysis.
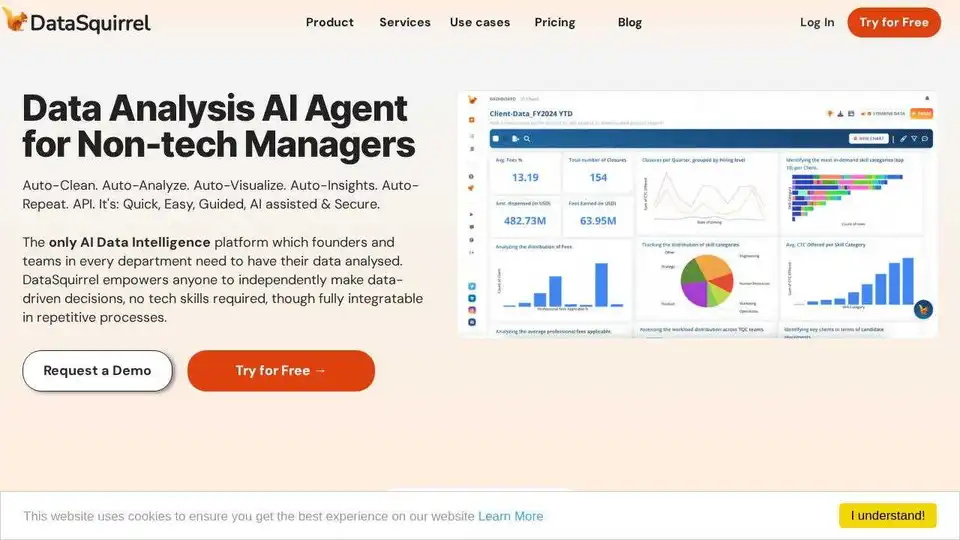
DataSquirrel.ai: Fast, safe AI-powered data analysis for business. Auto-clean, analyze, visualize & share data. No formulas or pivot tables needed.
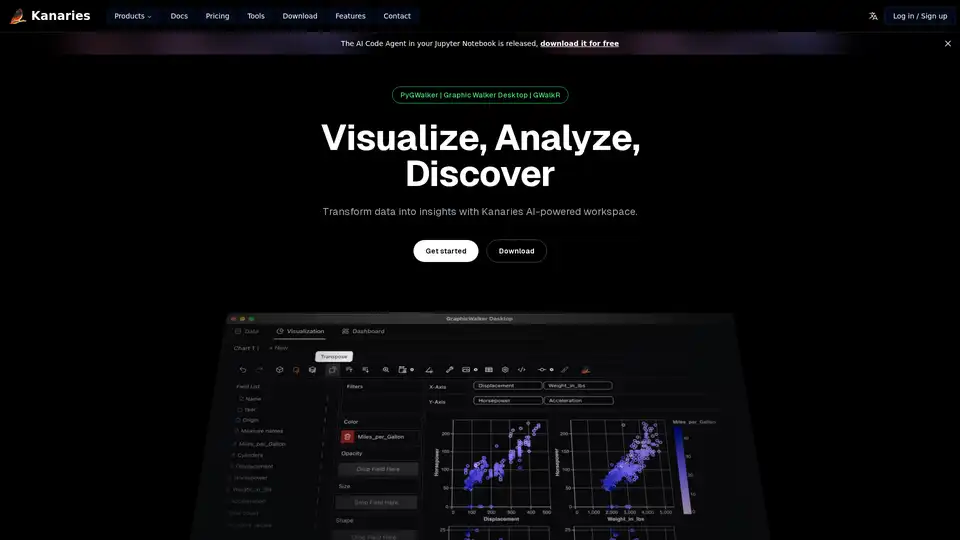
Make exploratory data analysis (EDA) easier with AI powered visual analytics. Discover, Analyze and Share data insights with ease.
Avanzai empowers asset managers with AI-driven workflow automation. Our agents leverage your data and tools to streamline report generation, risk alerts, scenario analysis, and insights—accelerating decision-making in today's dynamic financial markets.
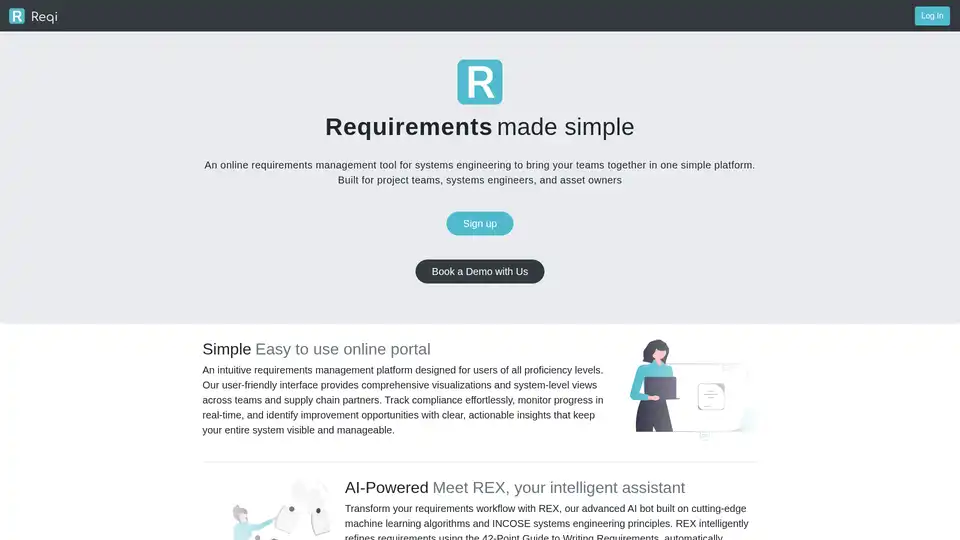
Reqi is an intuitive online requirements management platform for systems engineering, powered by AI assistant REX. It simplifies collaboration, traceability, and risk management across teams and supply chains, ensuring efficient project delivery.

ReadPartner is a media intelligence platform consolidating media monitoring, data analysis, and department briefing into one dashboard. Monitor news, social media, and trends with AI.
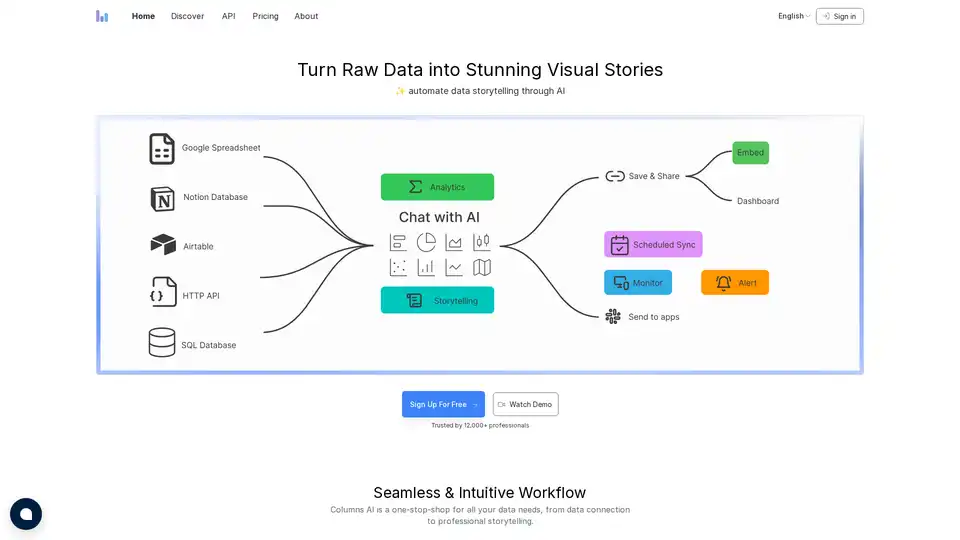
Columns AI is a data visualization platform that automates data storytelling using AI. It allows users to connect to various data sources, transform data into visual narratives, and share insights with teams and clients.
Sourcetable is the AI spreadsheet for analysts, operators, and finance teams. Automate workflows, build models, and create dashboards without code.
Blix is an AI-powered text analysis tool designed to quickly and easily transform open-ended survey responses and online reviews into actionable business insights. It automates coding and analysis, saving time and resources.
ChartFast is an AI data analyst tool that automates data visualization and analysis. It generates precise graphs in seconds, saving time and resources for data professionals.
Generate apps from your data using just a prompt. Edit visually as needed. Share with your team.
Threads Analytics is an AI tool powered by GPT-4 that transforms social media strategy with data-driven insights, audience analysis, and competitive benchmarking to boost your brand's online presence.
ChartFast is an AI data analyst tool designed to streamline data visualization and analysis tasks. Generate precise graphs in seconds and automate repetitive data work.