Line Graph Maker
Overview of Line Graph Maker
What is Line Graph Maker?
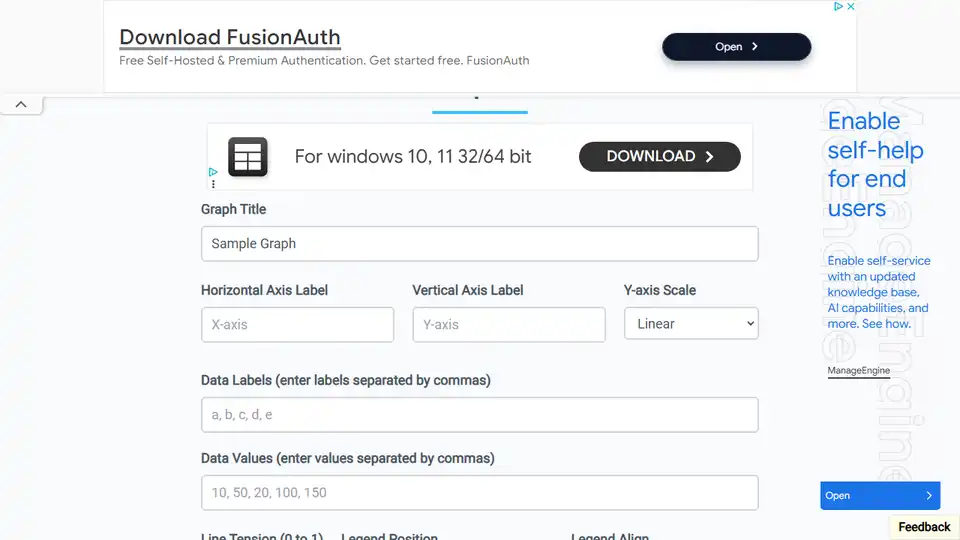
Line Graph Maker is an online tool that allows you to create line charts for free. It offers a user-friendly interface and various customization options to visualize your data effectively. You can download the created graphs as JPG or PNG files.
How to create a line graph using Line Graph Maker?
- Add a Title to your graph: Enter a descriptive title for your chart.
- Add Horizontal and Vertical axis labels: Label the axes to provide context to your data.
- Enter data labels separated by commas: Input the labels for each data point.
- Enter data values separated by commas: Input the corresponding values for each data label.
- Customize the line: Adjust the line tension according to your preference.
- Choose the position of the graph title: Select where you want the title to appear.
- Start values from zero: Optionally start the Y-axis from zero.
- Add/remove grid lines: Customize the grid lines for better readability.
- Download: Download your line graph as JPG or PNG format.
Why use Line Graph Maker?
- Free: The tool is free to use.
- Easy to use: The interface is intuitive and straightforward.
- Customizable: Offers various customization options to create graphs according to your needs.
- Downloadable: Allows you to download the graphs in popular image formats.
Where can I use Line Graph Maker?
Line Graph Maker can be used to visualize data in various contexts, including:
- Presentations: To present data in a clear and concise manner.
- Reports: To include visual representations of data in reports.
- Websites: To embed interactive charts on websites.
- Social Media: to create visuals for your social media channels.
Best Alternative Tools to "Line Graph Maker"
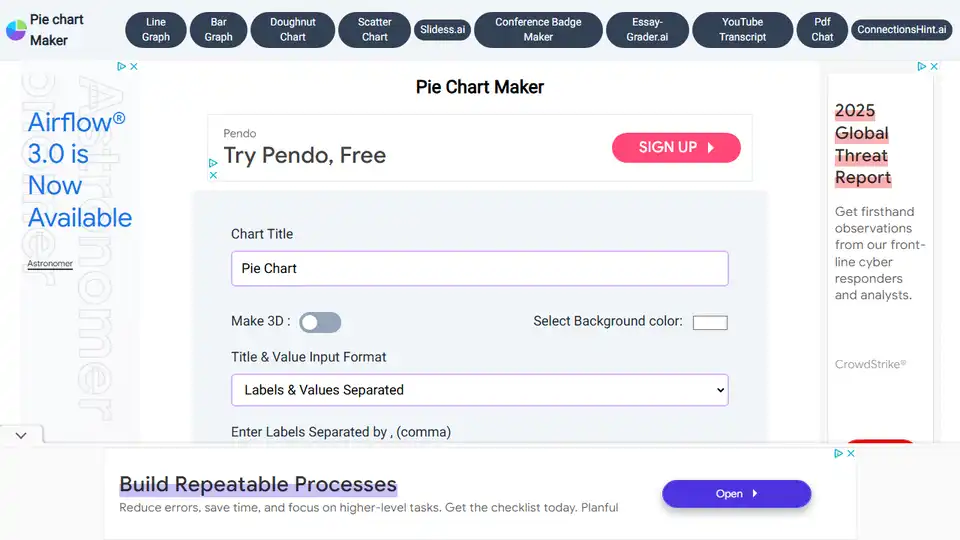
Create stunning pie charts for free with Pie Chart Maker. Easy to use tools, customizable options, and download as JPG, PNG, or SVG. Visualize your data effectively.
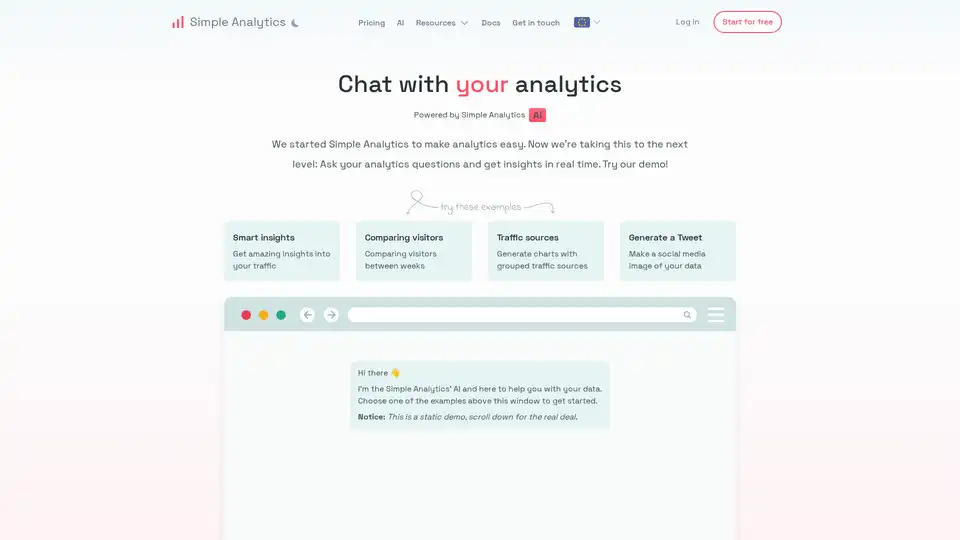
Chat with your analytics data and generate insights and beautiful charts.

Create professional presentations in minutes with AI Presentation Maker, a free online AI PPT generator. Convert text to presentations effortlessly, ideal for business, education, and creative projects.
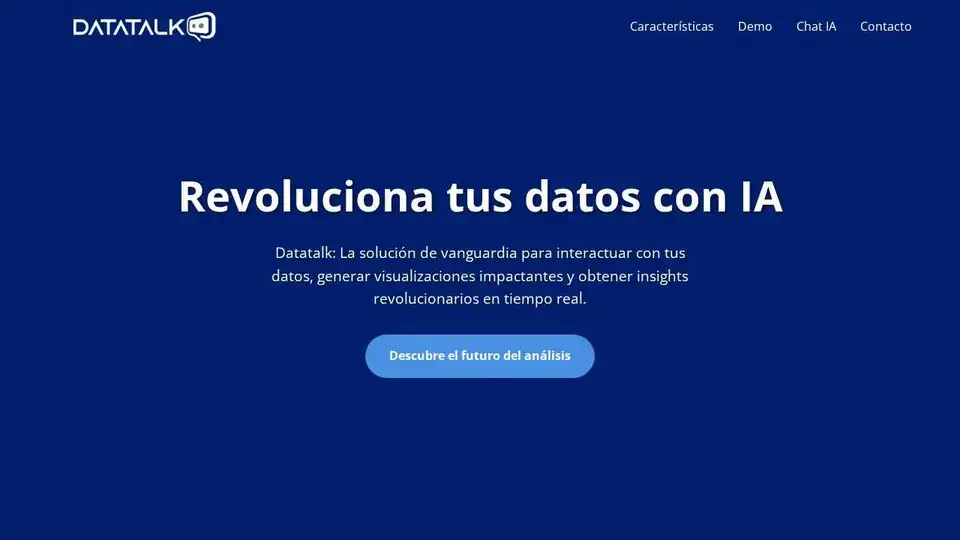
Datatalk: AI-powered solution for data interaction, visualization, and real-time insights. Chat with your data, generate graphics, and perform intelligent web scraping.

MeilleurMood is an AI-powered online journaling app for personal development and mental health management. Track your well-being and analyze your emotions over time. Try it for free!
Discover ChatGPT Deep Research Free, the top online alternative to OpenAI's Deep Research for those without access. Perform in-depth AI-powered web research, generate detailed reports with citations, and explore complex queries efficiently—all for free.
Graphy is an AI-powered graph maker that simplifies data storytelling. Create stunning data visualizations from messy data in a click. Trusted by 300,000+ users.
Create interactive charts with AI Graph Maker. Turn your data to custom bar charts, line charts, flowcharts, pie charts and scatter plots with AI effortlessly.
CalcGen AI uses AI to transform data into interactive charts, graphs, and calculators. Upload data tables or images to create visualizations for business and education.

ChartFast is an AI data analyst tool that automates data visualization and analysis. It generates precise graphs in seconds, saving time and resources for data professionals.
Columns AI is a data visualization platform that automates data storytelling using AI. It allows users to connect to various data sources, transform data into visual narratives, and share insights with teams and clients.
DatumFuse.AI™ is an AI platform that transforms messy spreadsheets and CSVs into presentation-ready stories. It cleans, enriches, and explains data, offering AI-powered visualization, data harmonization, and SEO keyword research.
Chat2CSV transforms CSV data into charts using natural language. Simply chat with the tool to create various charts. Secure, privacy-focused, and AI-supported.
Bricks is an AI-powered platform that transforms CSV and Excel files into visually appealing and editable dashboards effortlessly. It simplifies data analysis and reporting for users of all skill levels.