vizGPT
Overview of vizGPT
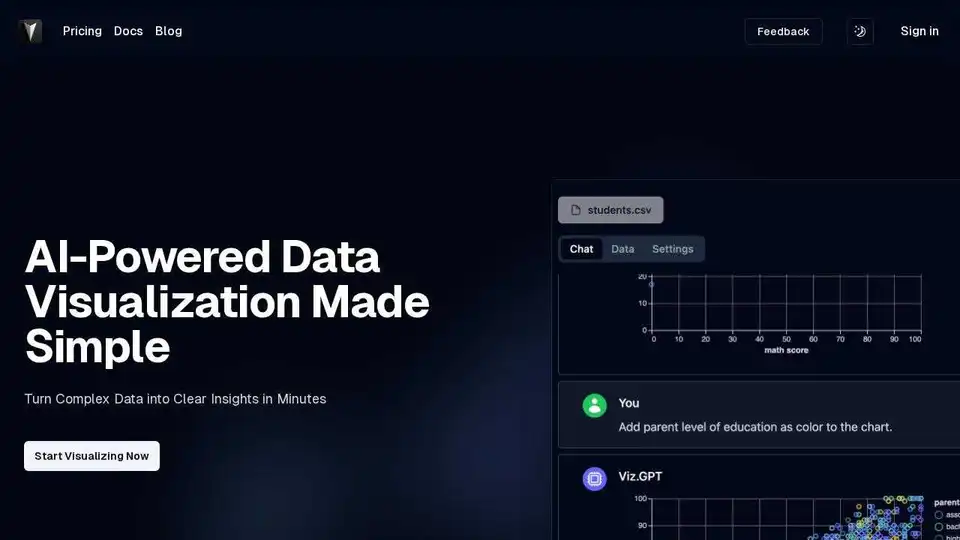
What is vizGPT?
vizGPT is an AI-powered data visualization tool designed to transform complex tabular data into clear and insightful visualizations. It allows users to interact with their data in a conversational manner, leveraging Natural Language Processing (NLP) to generate visualizations through simple questions and commands.
How to use vizGPT?
You can use vizGPT through both a drag-and-drop interface and a natural language interface. Simply upload your data, and then either drag and drop elements to create visualizations or ask questions in plain language to generate them automatically.
Key Features:
- Visual Contextual Understanding: The AI understands the context of data analysis, especially for visualization.
- Intelligent Conversation Context: Engage with the AI in a conversational manner to generate visualizations without syntax errors.
- Natural Language Processing: Easily analyze data by asking questions in plain language.
- Real-Time Responses: Get visualizations instantly by asking a question.
- Contextual Memory: The AI remembers past queries to ensure a cohesive analysis narrative.
- No Code GUI: Visualize data with a drag-and-drop interface.
- Data Transformation and Profiling: Easily transform and profile your data with powerful intelligent data tables.
Why is vizGPT important?
vizGPT simplifies data analysis by making it accessible to everyone, regardless of their coding skills. It allows users to quickly extract insights from their data, identify trends, and make informed decisions. The tool's conversational approach to data visualization makes it an efficient and intuitive solution for data exploration.
Where can I use vizGPT?
vizGPT is suitable for various applications, including:
- Business intelligence
- Data analysis
- Research
- Education
Best way to visualize data with vizGPT?
The best way to visualize data with vizGPT is to start with a clear question or goal. Define what you want to learn from your data and then use the natural language interface to ask specific questions. Experiment with different chart types and visualizations to find the best way to represent your data and communicate your findings effectively.
Best Alternative Tools to "vizGPT"
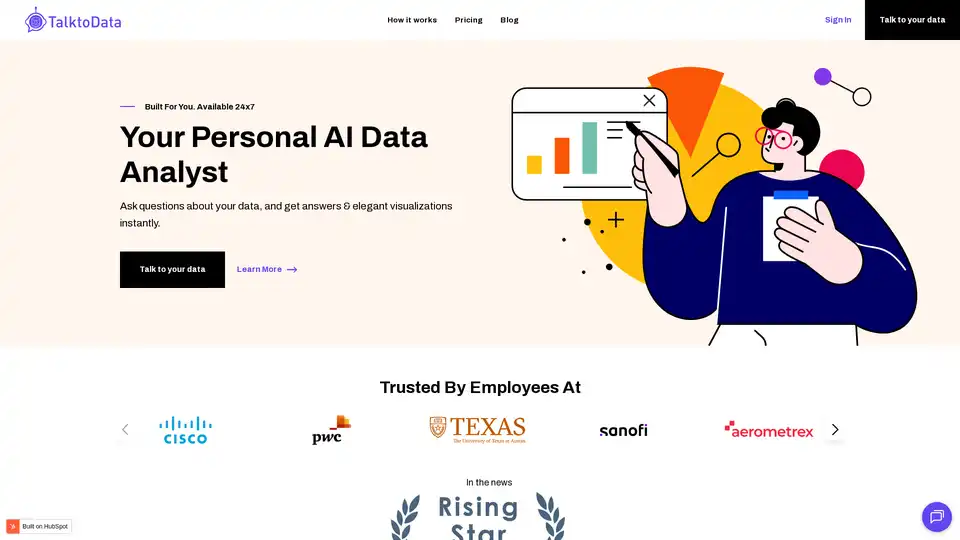
TalktoData AI is an AI-powered data analyst that allows you to connect to your data sources, ask questions in natural language, and get instant answers and visualizations. It simplifies data analysis for everyone.
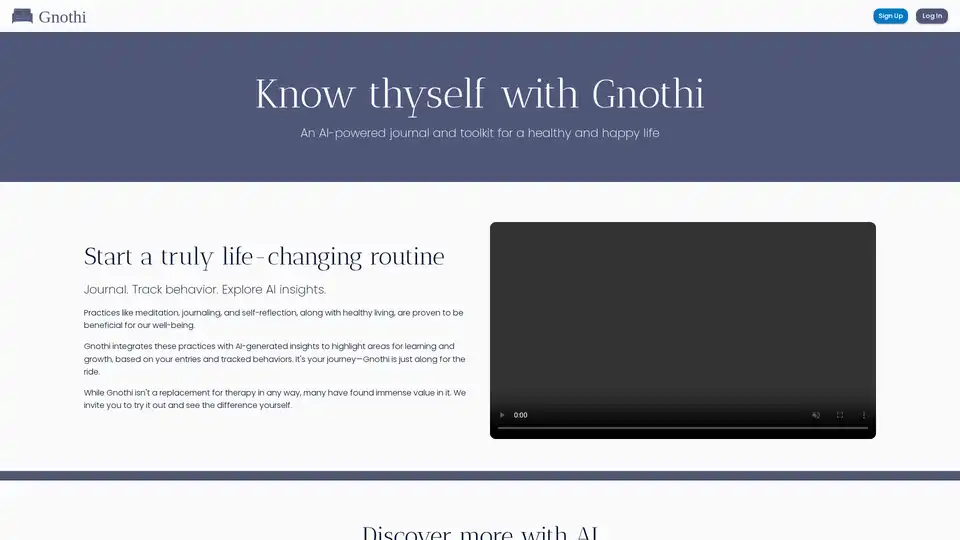
Gnothi is an AI-powered journal that provides personalized insights and resources for self-reflection, behavior tracking, and personal growth through intelligent analysis of your entries.
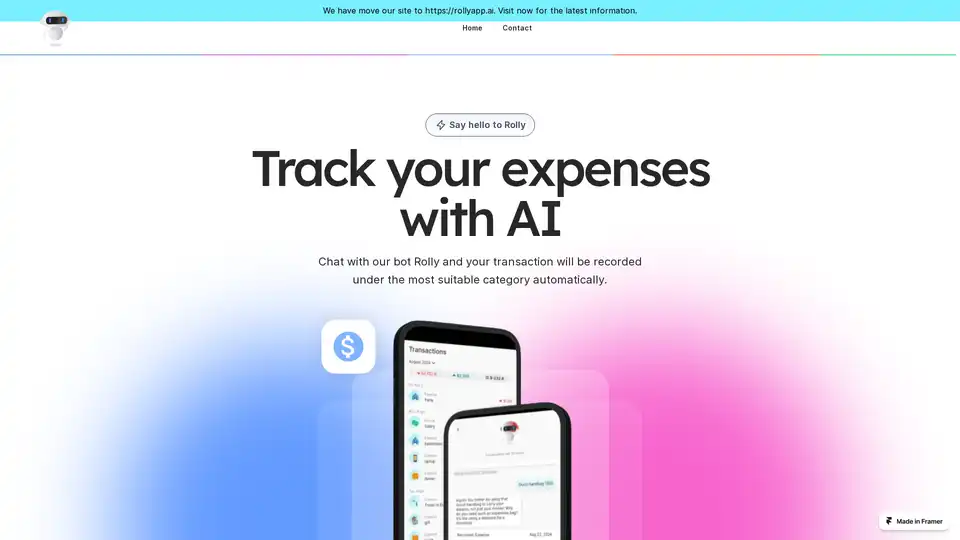
Rolly is an AI-powered money tracker that simplifies expense and income management through intuitive chat interactions, automatically categorizing transactions for accuracy and ease.
Capalyze is a data analytics tool that empowers businesses with insights through multi-source integration and web data crawling, driving smarter decisions.
Chat with your analytics data and generate insights and beautiful charts.
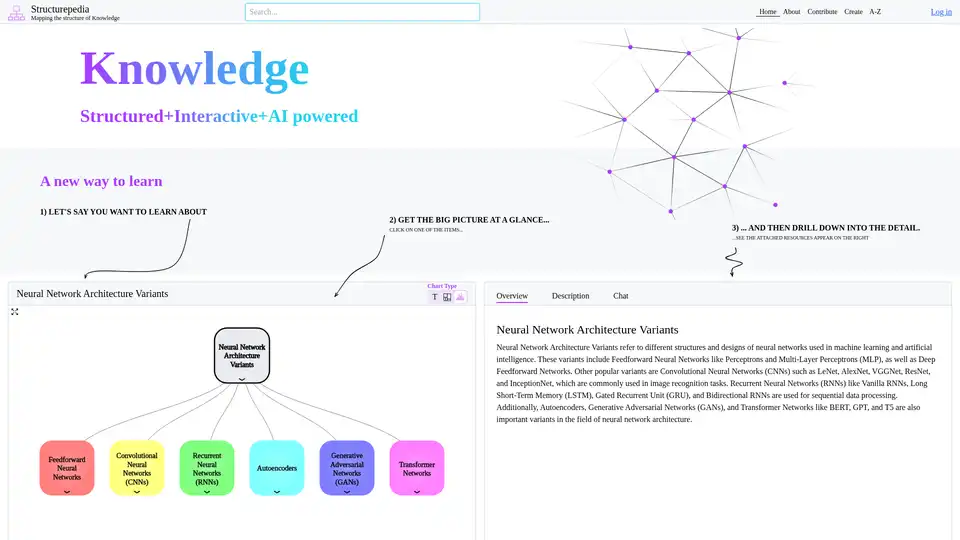
Discover Structurepedia, an AI-powered platform for visual web search and interactive knowledge trees. Explore complex topics like neural networks with structured diagrams and resources for free, enhancing learning efficiency.
Make exploratory data analysis (EDA) easier with AI powered visual analytics. Discover, Analyze and Share data insights with ease.
Hex is the AI-powered analytics workspace designed for teams to drive faster answers, better decisions, and collaborative data exploration with notebooks, apps, and self-serve tools.
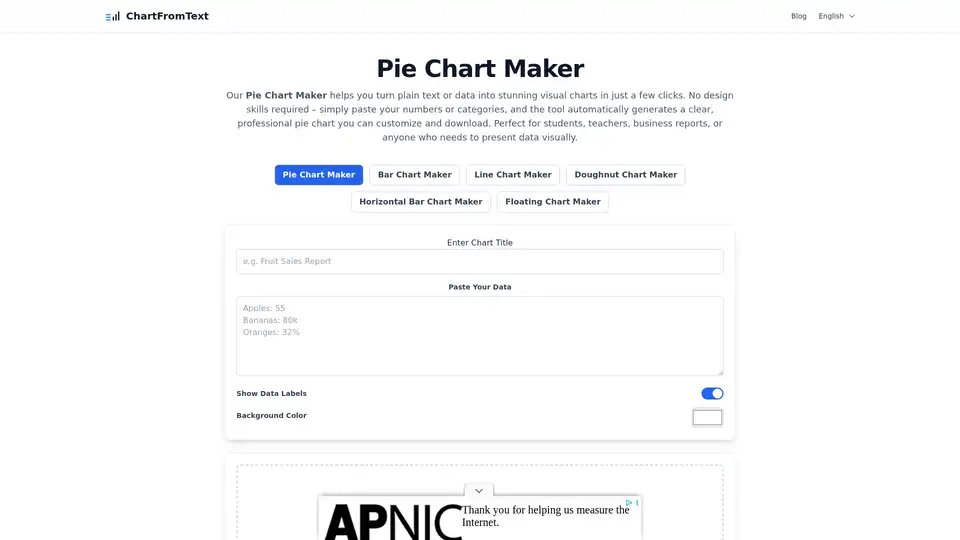
Create the best Pie Chart online for free with our Pie Chart Maker. Quick, customizable, and perfect for reports, projects, and presentations.
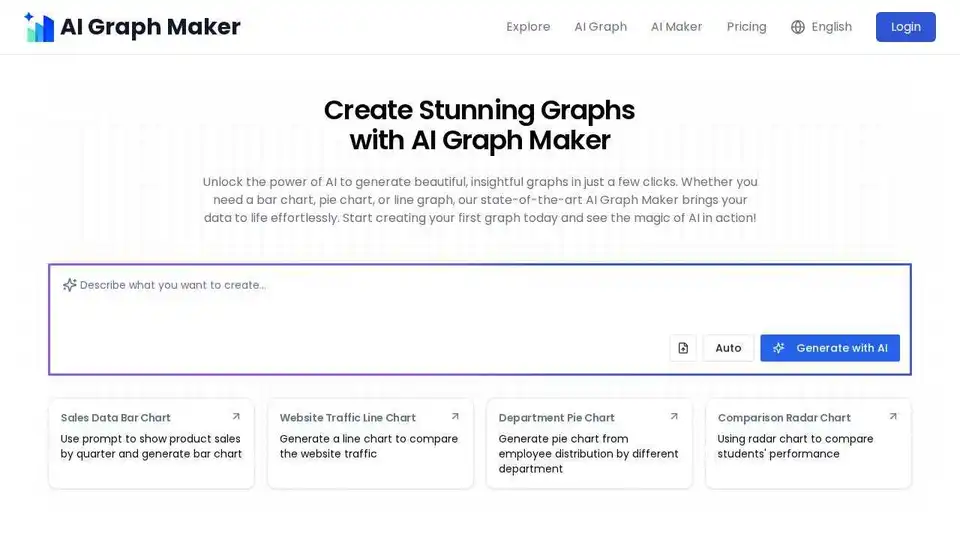
Create interactive charts with AI Graph Maker. Turn your data to custom bar charts, line charts, flowcharts, pie charts and scatter plots with AI effortlessly.
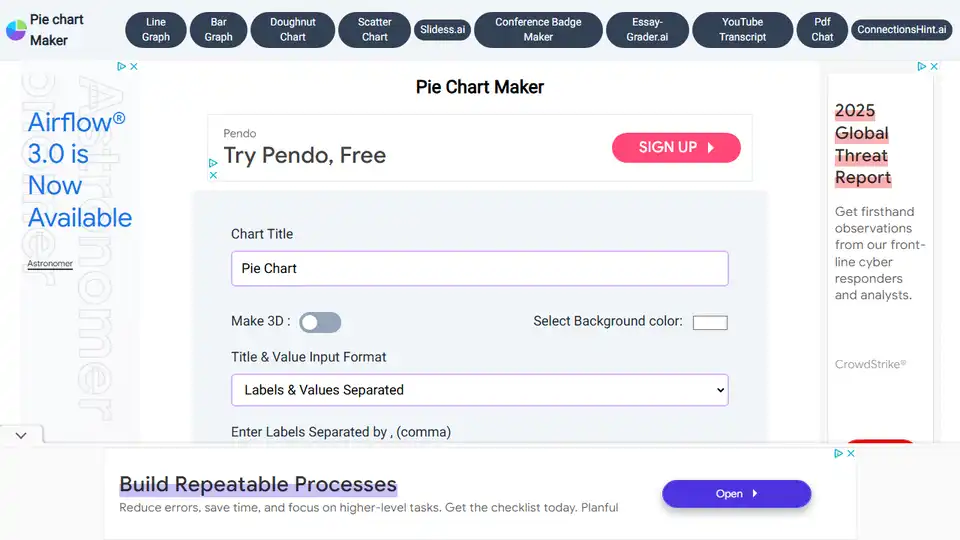
Create stunning pie charts for free with Pie Chart Maker. Easy to use tools, customizable options, and download as JPG, PNG, or SVG. Visualize your data effectively.
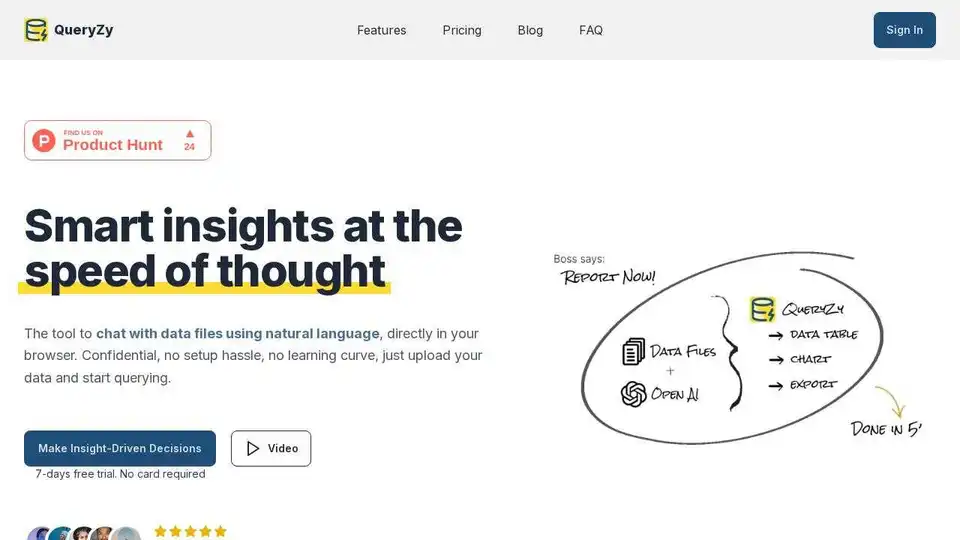
QueryZy is an AI-powered data analysis tool that allows you to chat with CSV, JSON, ARROW, and PARQUET files using natural language. Build stunning reports effortlessly.
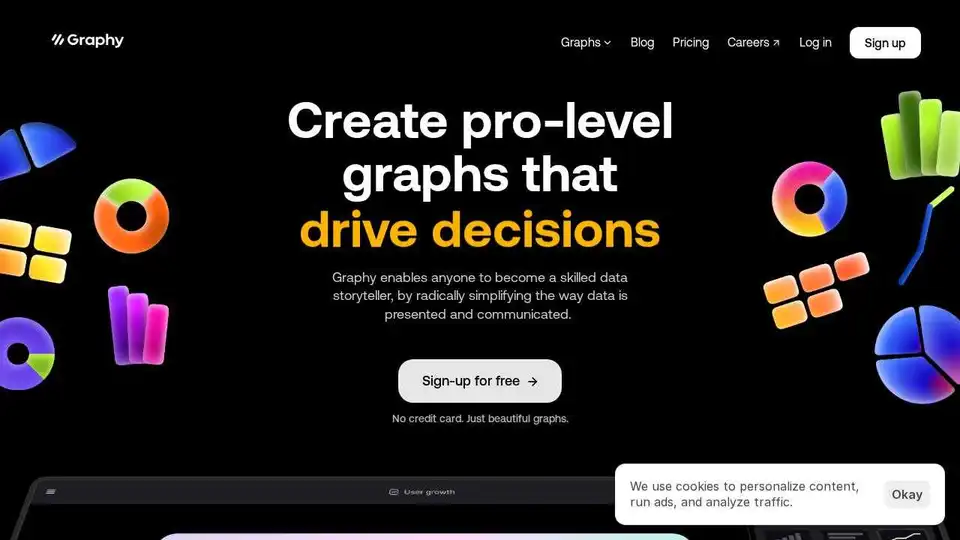
Graphy is an AI-powered graph maker that simplifies data storytelling. Create stunning data visualizations from messy data in a click. Trusted by 300,000+ users.
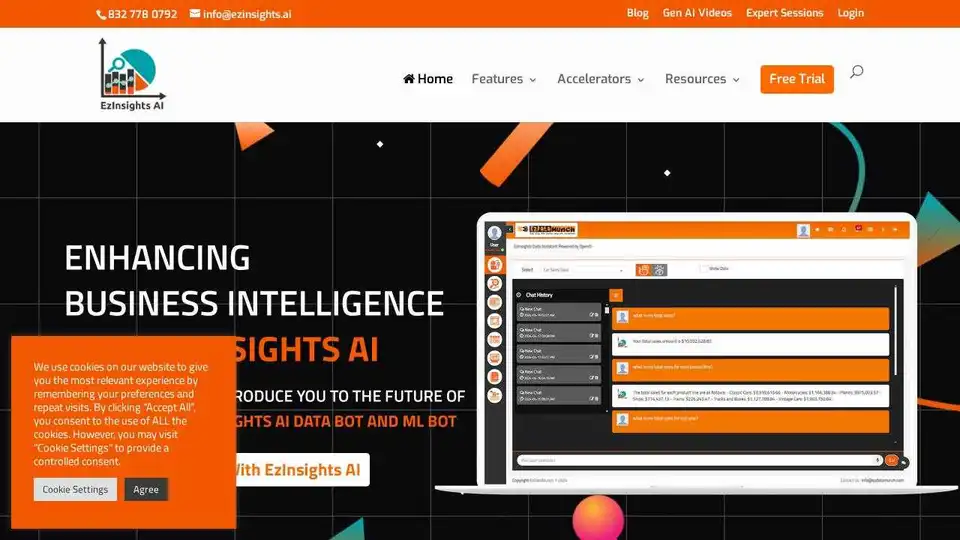
EzInsights AI is a business intelligence platform that analyzes your data with smart search. Get instant insights using natural language queries and make data-driven decisions.