CalcGen AI
Overview of CalcGen AI
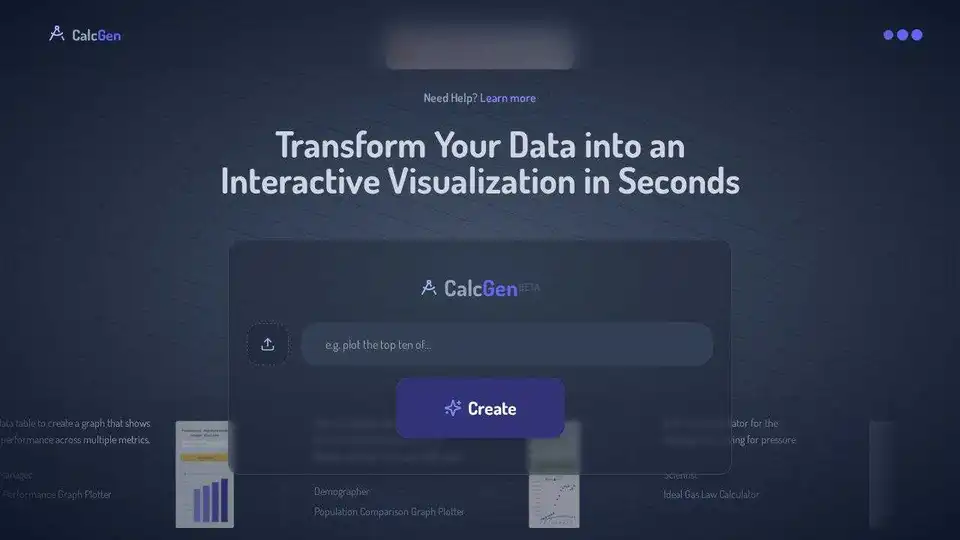
CalcGen AI: Transform Data into Interactive Visualizations
CalcGen AI is an innovative AI-powered tool designed to effortlessly convert your data into interactive charts, graphs, calculators, and data visualizations. Whether you're a finance manager, demographer, scientist, or educator, CalcGen AI offers a seamless way to enhance data storytelling and insights.
What is CalcGen AI?
CalcGen AI is a web-based application that allows users to upload images and data tables to automatically generate interactive visualizations. It simplifies the process of creating compelling data presentations, making it accessible to users with varying levels of technical expertise.
How does CalcGen AI work?
CalcGen AI utilizes advanced AI algorithms to analyze uploaded data and generate relevant visualizations. Users simply provide their data, and CalcGen AI handles the complex task of transforming it into an understandable and engaging format. The platform supports various data inputs, allowing for versatile applications across different domains.
Key Features and Use Cases
CalcGen AI caters to a wide range of professions and industries. Here are some notable use cases:
- Financial Analysis: Plot financial performance across multiple metrics, create quarterly financial calculators, and analyze solar investment savings.
- Demographics: Compare population data over extended periods.
- Science and Engineering: Build calculators for ideal gas laws and Bernoulli equations.
- Real Estate: Determine the ROI of rental properties.
- Automotive Industry: Compare used vehicle prices across different models.
- Education: Visualize sports participation data or element density versus proton number.
Examples of CalcGen AI in Action
CalcGen AI provides a variety of pre-built templates and examples to inspire users and showcase the platform's capabilities. Some popular examples include:
- Financial Performance Graph Plotter: Turns your financial data into an easy-to-understand graph.
- Population Comparison Graph Plotter: Compares the population of different locations over time.
- Ideal Gas Law Calculator: Solves for pressure based on the ideal gas law.
- Roofing Quote Generator: Creates a quote estimator for roofing businesses based on square footage and materials.
- Rental Property ROI Calculator: Determines the ROI of rental properties based on mortgage and rent.
Who is CalcGen AI for?
CalcGen AI is designed for:
- Businesses: Enhance presentations and data storytelling for better decision-making.
- Educators: Create engaging visual aids for students.
- Data Analysts: Simplify data analysis and reporting.
- Scientists and Engineers: Generate calculators for complex formulas.
- Finance Professionals: Visualize financial data and investment scenarios.
Why is CalcGen AI important?
CalcGen AI is important because it democratizes data visualization. It eliminates the need for complex software and specialized skills, allowing anyone to create insightful and engaging visualizations quickly and easily. This empowers users to make better decisions, communicate more effectively, and gain deeper insights from their data.
How to Use CalcGen AI
- Access the Platform: Visit the CalcGen AI website.
- Upload Your Data: Upload your data table or image.
- Select a Template or Create Your Own: Choose from a variety of pre-built templates or customize your visualization.
- Generate Your Visualization: Let CalcGen AI transform your data into an interactive chart, graph, or calculator.
- Embed or Share Your Visualization: Embed your visualization on your website or share it with others.
Best Ways to Leverage CalcGen AI
- Choose the Right Visualization: Select the visualization type that best represents your data and insights.
- Customize Your Visualization: Tailor the appearance of your visualization to match your brand or personal style.
- Provide Clear Labels and Descriptions: Ensure your visualization is easy to understand by providing clear labels and descriptions.
- Use Interactive Elements: Take advantage of interactive elements such as tooltips and zoom to enhance user engagement.
SEO Optimization
CalcGen AI helps in:
- Informational Intent: Providing a clear explanation of what it is and how it works.
- Transactional Intent: Offering a direct way to generate interactive charts and calculators.
By integrating keywords like "AI chart generator," "AI graph creator," and "data visualization," CalcGen AI enhances its search engine visibility, attracting users who are actively seeking solutions for data visualization needs. Furthermore, long-tail keywords such as "create interactive charts with AI" and LSI keywords like "data storytelling" and "visual analytics" are incorporated to broaden the reach and relevance of the content.
CalcGen AI transforms your raw data into visually stunning and interactive presentations, unlocking new insights and enhancing communication across various industries. Whether for financial analysis, scientific exploration, or educational purposes, CalcGen AI empowers users to make data more accessible and impactful.
Best Alternative Tools to "CalcGen AI"
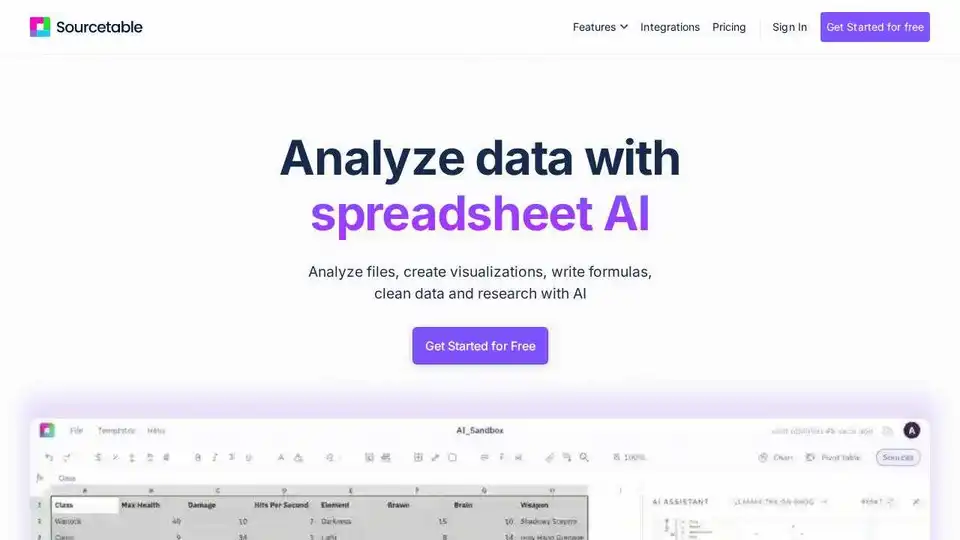
Sourcetable is the AI spreadsheet for analysts, operators, and finance teams. Automate workflows, build models, and create dashboards without code.
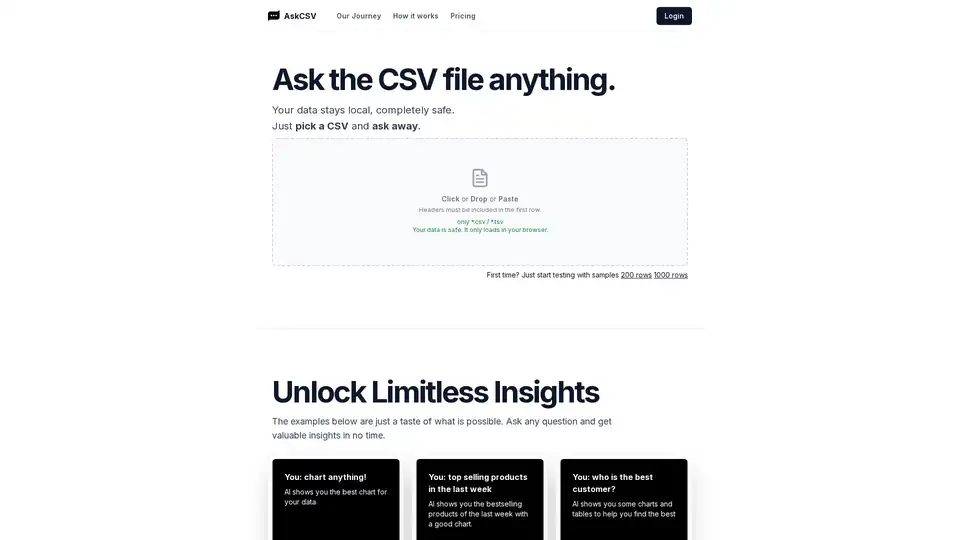
Simplify Data Analysis with CSV Files: Anyone Can Analyze Data with Ease.
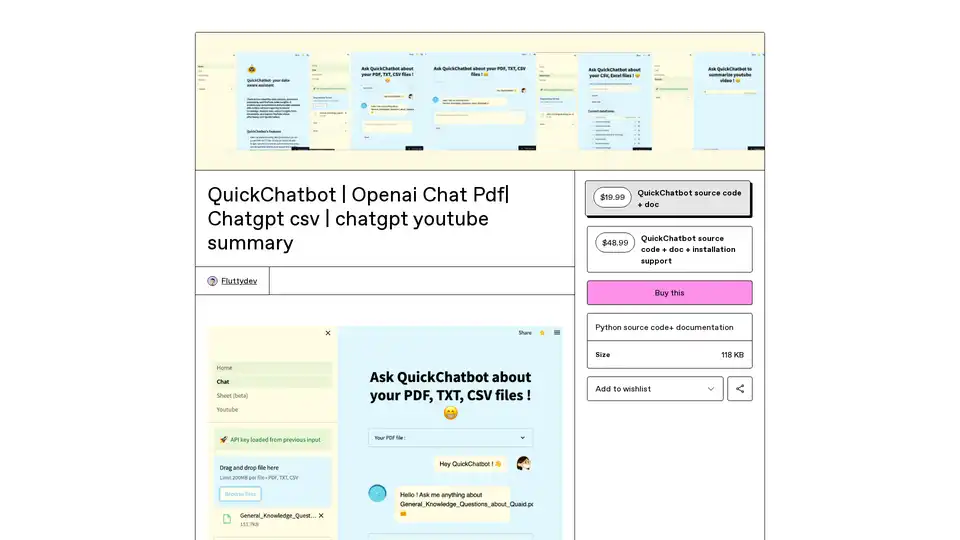
QuickChatbot is an open-source AI platform powered by GPT-3 for seamless data analysis, PDF/TXT document processing, and YouTube video insights. Upload files, ask questions, and get summaries effortlessly.
Wolfram|Alpha is a computational intelligence engine that provides expert-level answers using Wolfram's algorithms, knowledgebase, and AI. It covers math, science, society, and everyday life.
ChartFast is an AI data analyst tool designed to streamline data visualization and analysis tasks. Generate precise graphs in seconds and automate repetitive data work.
QueryLab provides instant AI-powered database sandboxes for querying, visualization, and external data integration. It simplifies data interaction using natural language and AI-driven automation.
Create interactive charts with AI Graph Maker. Turn your data to custom bar charts, line charts, flowcharts, pie charts and scatter plots with AI effortlessly.
Dataslide.ai automatically generates stylish PDF presentations from your data. Upload your data file and let AI discover key insights, produce visualizations, and apply machine learning. Supports .csv, .xlsx, .json, etc.

Create professional presentations in minutes with AI Presentation Maker, a free online AI PPT generator. Convert text to presentations effortlessly, ideal for business, education, and creative projects.
ChartFast is an AI data analyst tool that automates data visualization and analysis. It generates precise graphs in seconds, saving time and resources for data professionals.
Columns AI is a data visualization platform that automates data storytelling using AI. It allows users to connect to various data sources, transform data into visual narratives, and share insights with teams and clients.
DatumFuse.AI™ is an AI platform that transforms messy spreadsheets and CSVs into presentation-ready stories. It cleans, enriches, and explains data, offering AI-powered visualization, data harmonization, and SEO keyword research.
Chat with your analytics data and generate insights and beautiful charts.
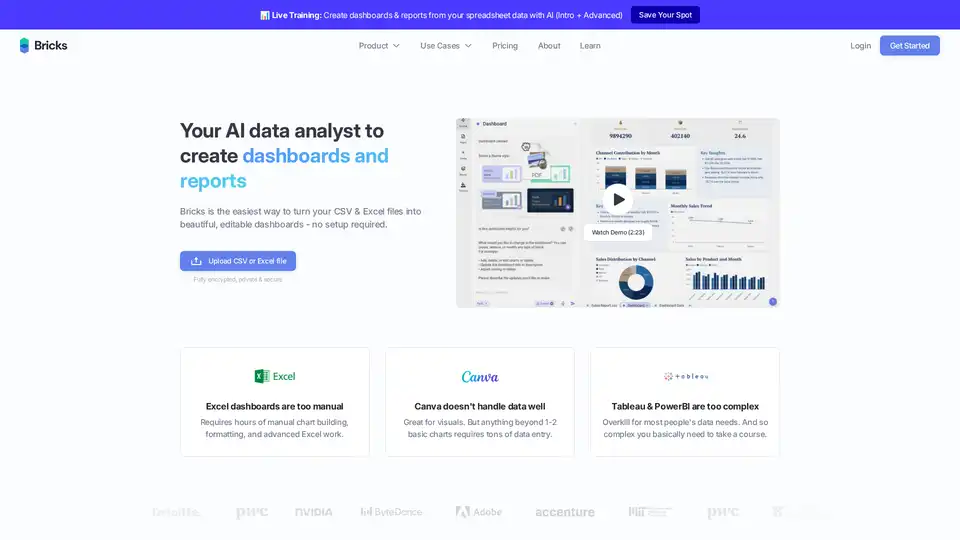
Bricks is an AI-powered platform that transforms CSV and Excel files into visually appealing and editable dashboards effortlessly. It simplifies data analysis and reporting for users of all skill levels.